
Documentary Evidence of 17th Century Landcover and Climate Change in Northern China and Mongolia Compared to Modern Spectral Greening Trends


1
Physical Geography, Institute of Environmental Social Science and Geography, University of Freiburg, Schreiberstr. 20, 79085 Freiburg, Germany
2
Department of Archaeology and Museology, Faculty of Arts, Masaryk University, Arne Nováka 1, 60200 Brno, Czech Republic
Land 2022, 11(1), 100; https://doi.org/10.3390/land11010100
Submission received: 29 November 2021
/
Revised: 31 December 2021
/
Accepted: 6 January 2022
/
Published: 8 January 2022
(This article belongs to the Special Issue Historical Data for Natural Hazard Risk Mitigation and Land Use Planning)
Abstract
:Fighting land degradation of semi-arid and climate-sensitive grasslands are among the most urgent tasks of current eco-political agenda. Particularly, northern China and Mongolia are prone to climate-induced surface transformations, which were reinforced by the heavily increased numbers of livestock during the 20th century. Extensive overgrazing and resource exploitation amplified regional climate change effects and triggered intensified land degradation that forced policy-driven interventions to prevent desertification. In the past, however, the regions have been subject to continuous shifts in environmental and socio-cultural and political conditions, which makes it particularly difficult to distinguish into regional anthropogenic impact and global climate change effects. This article presents analyses of historical written sources, palaeoenvironmental data, and Normalized Difference Vegetation Index (NDVI) temporal series from the Moderate Resolution Imaging Spectroradiometer (MODIS) to compare landcover change during the Little Ice Age (LIA) and current spectral greening trends over the period 2001–2020. Results show that decreasing precipitation and temperature records triggered increased land degradation during the late 17th century in the transition zone from northern China and Inner Mongolia Autonomous Region to Mongolia. From current climate change perspectives, modern vegetation shows enhanced physical vegetation response related to an increase in precipitation (Ptotal) and temperature (T). Vegetation response is strongly related to Ptotal and T and an increase in physical plant condition indicates local to regional grassland recovery compared to the past 20-year average.
1. Introduction
Climate and land cover changes, heavy grazing, and agricultural and resource exploitation contribute significantly to land degradation and desertification processes in sensitive arid and semi-arid regions of Earth [1,2,3,4,5,6,7,8]. Particularly, seasonal vegetation cover plays a major role in the ecosystem’s functionalities, affecting soil development, sediment deposition, water infiltration rate, and wind-driven erosion during high-cover and low-cover periods and within the spatial patterns of species differentiation [9,10,11]. From a historical perspective, seasonal vegetation dynamics control transhumance (seasonal nomadic), socio-cultural, and socio-economic strategies, which nowadays have turned into politically motivated intensified sedentary patterns with regional and supra-regional environmental overstraining. In many cases, severe surface damage and sandy desertification were caused through increased livestock grazing [6,12,13,14,15]. The system-inherent interactions of land degradation, climate forcing, anthropogenic impact, and ecological functionalities have been recently emphasized by multiple authors, who suggested complexity not only within physically, but also socio-culturally controlled systems [5,12,16,17].
Particularly, China’s Inner Mongolia Autonomous Region and Mongolia have experienced massive political and economic development during the past decades, which enabled a strong transformation of the social, rural, and environmental life [18,19,20,21,22], followed by governmental grassland restoration projects and policies to prevent desertification [23,24,25]. Although the modern anthropogenic impact on semi-arid environments of the region has recently been emphasized by many authors [13,19,26,27,28], isolating the climatic signal affecting land degradation processes from human-induced landcover change still provides a great challenge [27,29].
In this article, historical documentary sources from 1688 AD were used to evaluate non-standardized measures of climatic and surface conditions during the Little Ice Age (LIA) in northern China and Mongolia and to compare them to modern landcover development, partly deriving from satellite hyperspectral imagery, Copernicus Global Land Service data, and historical and current climate proxy datasets. The historical data allows the surface vulnerability and land transformation processes through intensified wind-blown sand transport during the exceptional cold and dry period of the so-called Maunder Minimum of the Little Ice Age to be traced [30,31,32,33,34,35]. The comparison of surface conditions during the late 17th century AD further enables the evaluation of current global climate change and the cross-validation of the strong anthropogenic overprint in semi-arid grasslands of northern China and southern Mongolia [21]. Here, a particular focus is put on global spectral greening trends and vegetation response to global warming. Eventually, this article emphasizes the applicability of historical written sources to understand not only past but also current climate change effects on the local to the regional scale, a methodological problem, which has recently gained further momentum [17,36,37,38,39].
2. Materials and Methods
2.1. Environmental Settings
The core research area covers southern Mongolia, China’s Inner Mongolia Autonomous Region, and parts of China north of Beijing (Figure 1). Mongolia is a landlocked country north of China with a highly continental climate, extremely cold and dry winters, and short and hot summers [40]. After long-term summer droughts, climate extreme events in winter (dzud) have frequently led to severe livestock perish, which caused a strong socio-economic crisis due to a domestic product market dependency of about 20% [41,42]. Inner Mongolia is situated to the south at the northern margins of China and stretches from northeast to the northwest (37°30′–53°23′ N, 97° 10′–125°50′ E) [43]. Most of the plateau-like elevated region is dominated by extensive grasslands, which are characterized by various types of steppe vegetation and a great sensitivity to climate and land-use change [44,45,46]. The climate is monsoon-controlled, arid to semi-arid with cold and dry winters and hot and more humid conditions during summer and towards the subhumid north-eastern part [43,44]. Different climatic zones have developed under a prevailing continental climate, with temperate and semi-humid conditions in the east and more semi-arid and arid conditions towards the western part [21]. Mean monthly precipitation ranges from 0–200 mm (long-term average < 200 mm [47]) with a peak during July and September (Figure 2), temporally limiting plant growth [21]. In combination with the high environmental vulnerability and climate extremes, the strongly increased water consumption for agricultural purposes, animal husbandry, and particularly intensified state-controlled mining activities has locally amplified the drought risk of the region and led to a sequence of water shortages [42,47,48,49,50].
2.2. Route Reconstruction and Historical Environmental Analysis
A comparison of historical written sources [52] and environmental data attributes was carried out to evaluate modern land degradation and desertification dynamics in northern China and southern Mongolia. Historical data derived from a day-by-day diary, documented by the French missionary Jean-François Gerbillon in the year 1688 during his employment at the imperial court at Beijing. While he was travelling from Beijing through Inner Mongolia and Mongolia during the period from the 30 May to the 6 October 1688, Gerbillon documented climatic and surface conditions as well as general environmental, social, cultural, and political phenomena [53]. From the documentary sources, a route model was reconstructed using terrain-dependent least-cost-path (LCP) analysis. The model is based on surface roughness and slope gradients because directional movement patterns were emphasized only in cardinal directions [54,55,56]. For this reason, a digital elevation model was downloaded from the United States Geological Survey (USGS, SRTM 1-arc-second/30 m resolution [57]) and resampled to a 100 m grid size. The route model was calculated in QGIS (QGIS Geographic Information System. QGIS Association. http://www.qgis.org, last accessed 5 January 2022) using a cumulative friction surface and movement directions between the single stopping points. Around the reconstructed route, a 20 km buffer was created to visualize the historical environmental conditions within a suitable range. The corridor does not represent the accessibility of the area but was chosen to interpolate the reconstructed point-based data to a raster. Climatic conditions were classified on a discrete scale from 1–6 with very hot (6), hot (5), warm (4), moderate (3), cold (2), and very cold (1). Wind speed was estimated using cardinal directions and four classes from calm (0), breeze (1), wind (2) to storm (3). Surface conditions were distinguished according to the Copernicus Global Land Cover collection using the classification into bare/sand (0), herbaceous (1), shrub (2), cropland/grassland (3), forest/mixed (4), built-up (5), and water surface (6) [58,59]. Climatic and surface data were interpolated within a 20 km range along the route to allow for comparison with modern landcover datasets. The data was then compared to modern land cover and temperature variations using the Copernicus Global Land Cover 100 m collection from 2019 [58] and precipitation and temperature comparison datasets [60,61].
2.3. Comparison Environmental Data
To measure the relationship between climate variables and vegetation feedback, a global NDVI monthly time series dataset (2000–2020) was acquired from the Earthdata server of the USGS (https://lpdaac.usgs.gov/products/mod13c2v006/, last accessed 16 April 2021) [62]. The data has a complete spectrum for the period 2001–2020. The year 2000 is incomplete and was partly removed for the trend analysis. The aridity index (Figure 1) is based on the Global Aridity Index and Potential Evapotranspiration Climate Database v2 [51] and was cropped to the administrative boundaries of Mongolia and China to visualize the broader environmental context of the study area. Because desertification and land degradation processes are strongly connected to windspeed and surface erosion, the historical wind direction and intensity were compared to modern data extracted from the Global Windatlas [63].
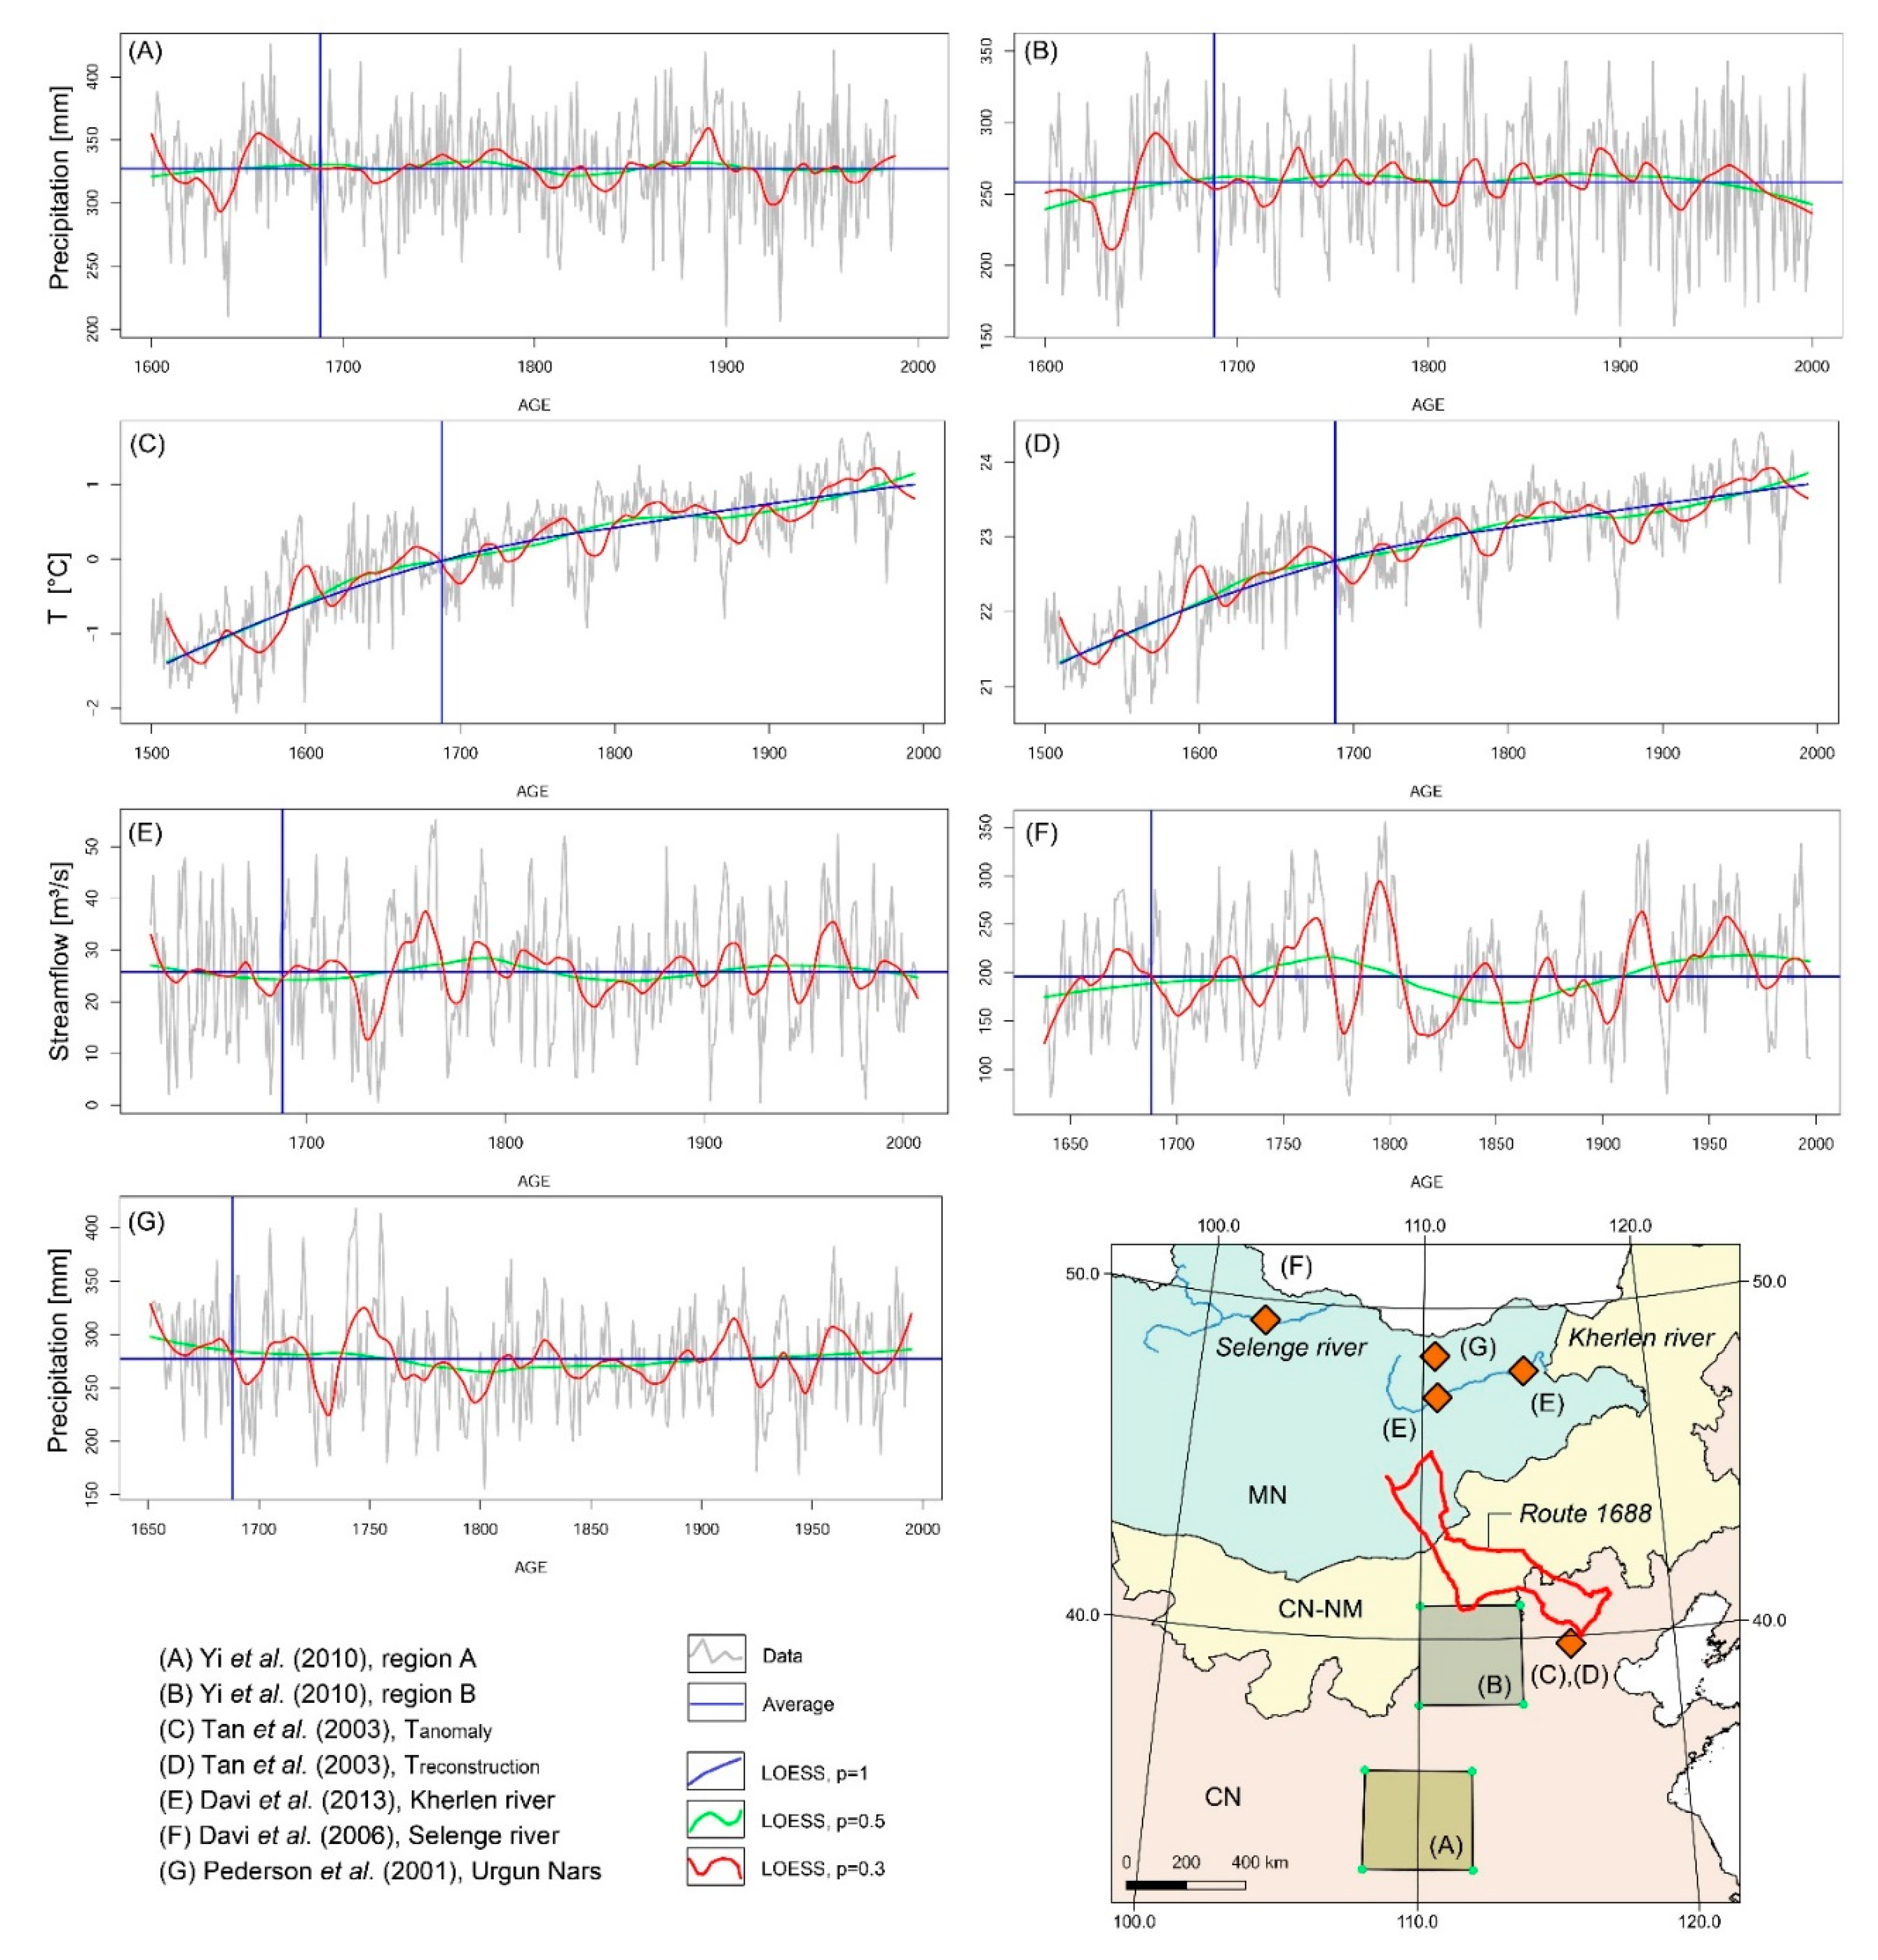
Due to the temporal variation of the surface and the climatic conditions, the study area was differentiated into equal monthly sectors using Voronoi polygons. Monthly maximum temperature and precipitation totals were plotted in each sector to trace the seasonal variability in Inner Mongolia and southern Mongolia over the summer period. To cross-check the historical data results, a set of comparison climate data was acquired from the National Centers for Environmental Information (NOAA, last accessed 5 January 2021) and plotted using a locally estimated scatterplot smoother (LOESS) [64] and the R environment (R: A language and environment for statistical computing. R Foundation for Statistical Computing, Vienna, Austria. URL https://www.R-project.org/, last accessed 5 January 2022) with smoothing parameters 1, 0.5, and 0.3. Temperature anomaly and reconstructed temperature is based on a stalagmite from Shihua Cave, Beijing, China and instrumental meteorological records [65]. Long-term streamflow variation of the River Kherlen derived from the dataset by Pederson and colleagues and spatial and temporal tree-ring replication and nested model methods by Davi and colleagues [7,66]. Streamflow variation of the river Selenge in Mongolia is based on tree-ring-width chronologies [67] and precipitation reconstruction in north-eastern Mongolia and for two regions in China derived from tree-ring-width data [7,68].
2.4. NDVI Temporal Anomalies, Trend Analysis, and Environmental Parameter Correlation
To trace the response of plant growth to precipitation and temperature variation in the study area, a temporal series of NDVI from MODIS/Terra Vegetation Indices Monthly L3 Global 0.05Deg CMG V006 imagery was created, which provide a pixel size of 5600 m and cover the period 2002–2020. Monthly total precipitation and monthly temperature were extracted from the CRU (Climate Research Unit) dataset [61]. The data comes in .nc file format and can be read and extracted using the ncdf4 package by David Pierce. Precipitation and temperature were used to compare climate change signals to global spectral greening trends [69,70]. Particularly, the early growing phase in Inner Mongolia [71] is sensitive to trends in precipitation and temperature variability, which impacts the growth behavior. A Spearman’s rank correlation was performed on raster annual time series stacks to analyze the spatial relationship between climate variables and vegetation response across China and Mongolia. Spectral greening and browning trends as well as trends in precipitation and temperature variability were identified using a pixel-wise raster analysis in R. The method and the workflow is well-described by Martin Brandt (2013) and is publicly available from the website (https://matinbrandt.wordpress.com/2013/11/15/pixel-wise-time-series-trend-anaylsis-with-ndvi-gimms-and-r/, last accessed, 28 December 2021).
The recent vegetation behavior in northern China and Mongolia was analyzed for yearly anomalies compared to the long-term record from 2000–2020. For this reason, the mean total NDVI value (m) and yearly average NDVI values were calculated from the cumulated monthly MODIS datasets. The standard deviation (SD) was calculated for all values and subtracted from and added to the multiannual mean value (m − SD; m + SD) to create the range of the standard deviation for the period 2000–2020. Consequently, annual NDVI anomalies were calculated by distinguishing into positive or negative deviation from the standard deviation range. For each year, the (m + SD) was subtracted from the annual mean NDVI value and all values ≤ 0 were removed. According to the lower limits of the standard deviation range, (m − SD) was subtracted from each annual mean NDVI value and all values ≥ 0 were removed. Eventually, a set of raster layer was generated, which shows negative and positive annual NDVI anomalies compared to the long-term temporal series of 20 years. Additionally, the histograms and density estimations of the anomaly value distribution were plotted to visualize the trends in physical plant activity (see the Supplementary Materials to this article). From the time series, a temporal plot and linear regression analyses were calculated to visualize the development in physical plant conditions in the study area. These anomaly datasets allow an understanding of the recent surfaces transformations in northern China to be obtained and comparison of them to past and current climate change models.
Figure 2.
Multiannual average monthly total precipitation and mean temperature over the period 2001–2020, based on CRU TS4.05 (Climatic Research Unit Time Series) gridded data of month-by-month variation [61].
Figure 2.
Multiannual average monthly total precipitation and mean temperature over the period 2001–2020, based on CRU TS4.05 (Climatic Research Unit Time Series) gridded data of month-by-month variation [61].

3. Results and Discussion
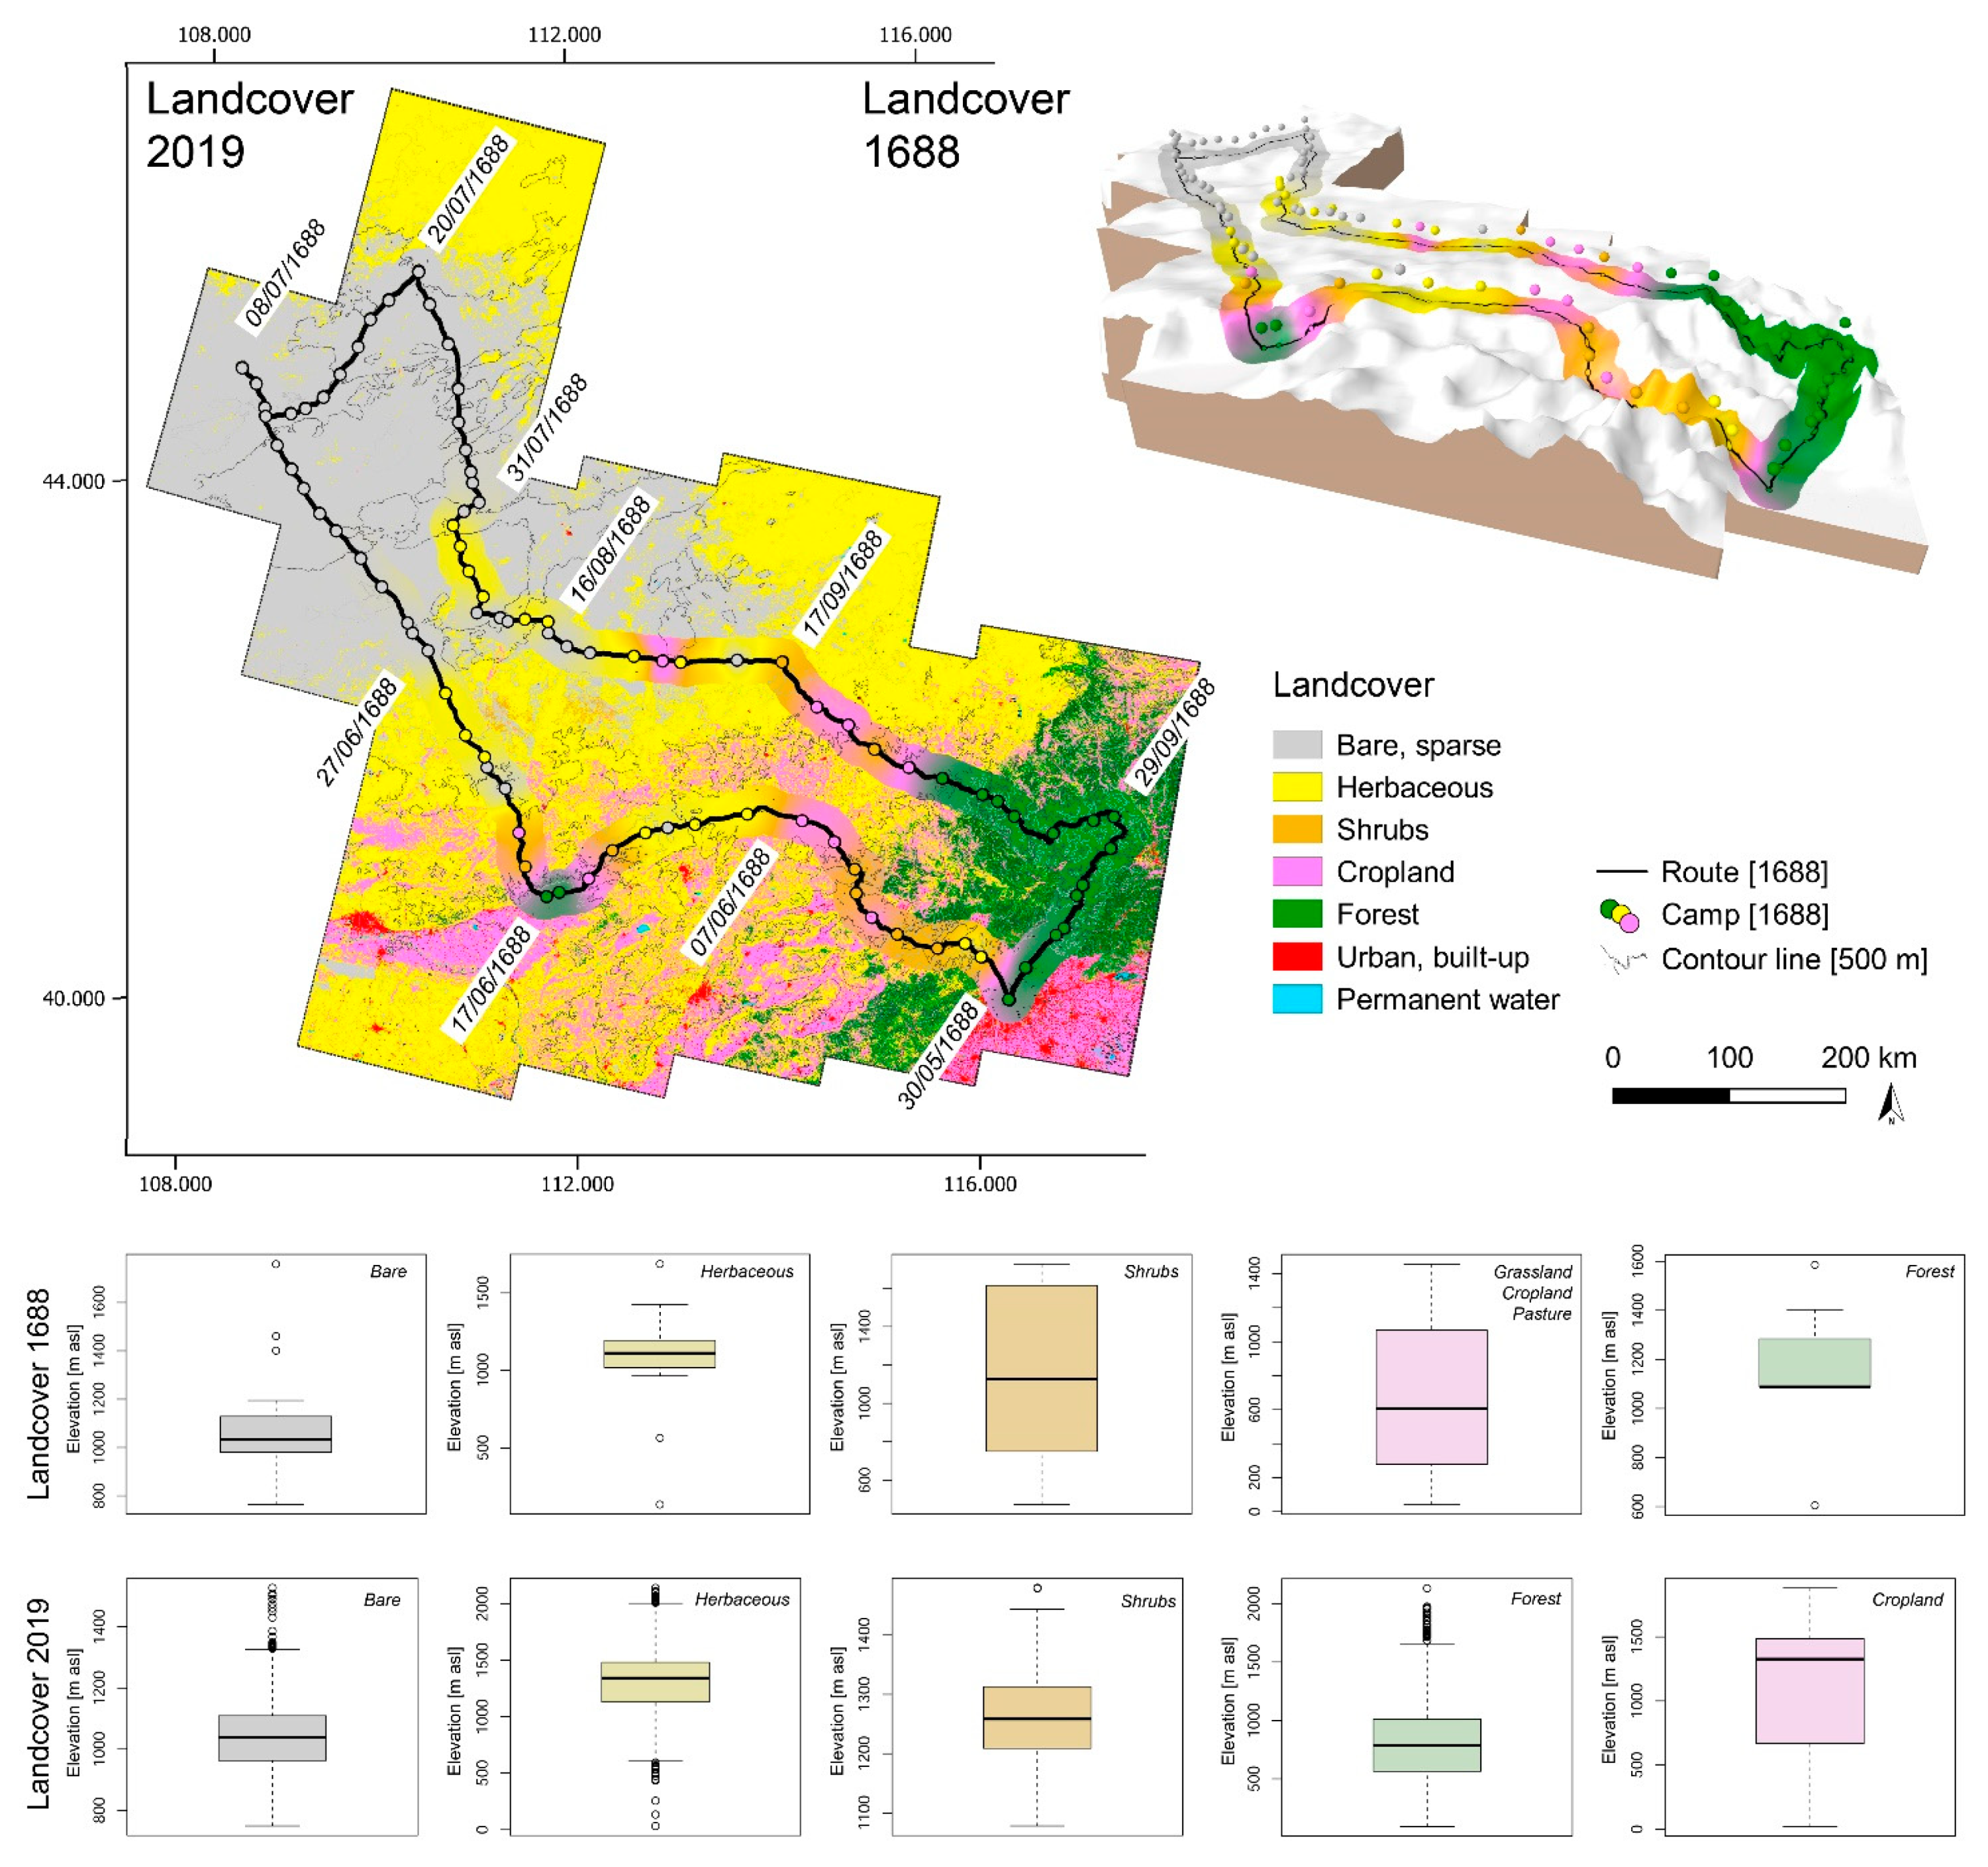
Today, the transition zone from northern China to Inner Mongolia and Mongolia is characterized by a pronounced landcover gradient from moderate forested areas in the south and the south-east to increasingly semi-arid and arid conditions towards the Mongolian Plateau and the extensive grasslands of Inner Mongolia and Mongolia (Figure 3). The Copernicus data highlights the modern landcover sequences and compares topographical features for each landcover class in the study area. Forested zones are mostly abundant in lower elevated areas of the subhumid belt north of Beijing. With increasing elevation, patterns of herbaceous grassland and shrubs prevail. Towards the north-west, extensive sandy lands occur with a mean elevation of about 1000 m a.s.l. Croplands are frequently interspersed into semi-arid grassland patches, which points towards an active anthropogenic land-use. Figure 3 further visualizes the historical route patterns and the daily camps of the travels of Gerbillon from 1688. From these route reconstructions, a cross-validation of hermeneutic sources and modern landcover and climate data was derived.
3.1. Historical Landcover Change and Environmental Reconstruction
A route was reconstructed from the historical data, which starts at Beijing on the 30 May 1688. Travelling to the north-west, the group crossed the mountain range north of China’s capital before entering the Mongolian Plateau on the first week of June. According to topographical changes, the landcover transformed rapidly from forested to sparsely forested and herbaceous surfaces, and then to shrubland, grassland, and steppe vegetation from the south-east to the north-west (Figure 3). During the first week, Gerbillon reported from small-scale agricultural crop production, which were interspersed into extensive grasslands. Furthermore, he frequently highlighted the absence of field systems despite the high suitability for intensive agricultural utilization of the region, which was connected to a prior nomadic lifestyle of the local population [21,22,72,73]. The weather conditions were generally very dry with very high temperatures during the onset of June and more humid and moderate conditions during the second half of the month when the group turned to the south-west and crossed extensive sandy grasslands with poor vegetation cover and bare hilltops (Figure 4). On the 17 June, they reached Hohhot, which is located on the Tumuochuan Plain and surrounded by the Hetao Plateau to the south and the Daqing Mountain to the north [74]. The average temperature (6.7 °C) and the annual total precipitation (400 m/a) at Hohhot are low, which supports a semi-arid steppe climate [74]. Both the modern data and the historical landcover reconstruction indicate forested zones in the area, which are probably connected to the lower elevation compared to the surrounding hills. After the 17 June, the group moved northwards, and the vegetation cover declined according to an increase in aridity and windspeed (Figure 5). After the 27th, Gerbillon reported from bare lands with no vegetation but loose sand coverage until the 31 July 1688. In contrast to the 2019 landcover, the 1688 landcover reconstruction shows increasing herbaceous vegetation patterns after the 31 July despite continuously very dry conditions during August. The surface description of the following period until the 17 September again differs considerably from modern landcover data. There is a signal towards more herbaceous and shrubby vegetation and increasing agricultural exploitation during the late 17th century. During the rest of September, the group travelled continuously to the east and entered the forested mountains around the 22 September. Compared to the modern data, the extent of the forested areas reached further to the north and the north-west, which is most likely linked to strong modern human impact, forest management and climate change during the first half of the 20th century [75]. Climatic conditions were reported to be very dry and extremely cold during October 1688, which aligns with the climatic tendency towards a drier and cooler period around 1700 AD and the climate depression during the Maunder Minimum of the LIA. From the palaeoenvironmental reconstructions, 1688 can be considered an extremely anomalous year compared to the long-term average and marks the transition into a generally colder and drier phase that lasts until about 1715/30 AD [35].
These findings are further supported by the windspeed model and the average wind direction from 1688 compared to modern data [63]. The diary reports continuously blowing wind with local extreme events and massively increased sand transport and dune activity. The reconstruction indicates an increase in windspeed and a general change in wind direction during the LIA (Figure 5). During the past decades, the landcover became even more vulnerable to wind erosion due to the locally decreased vegetation cover and intensified overgrazing, which reactivated sand depositions and enabled dust transportation and dune development. The accumulation of coarse particles further supported the degradation of cropland and pasture [76,77,78,79]. Sand and dust storms over Inner Mongolia were not only enhancing erosion and accumulation of fine-grained particles in the semi-arid steppe region but also led to the transportation of dust and high concentrations of particulate pollutants into the area of Beijing [80,81,82].
To cross-validate the hermeneutic sources, historical and current environmental conditions in the study area were evaluated using palaeoenvironmental proxies from different data sources [7,65,66,67,68] and interpolated datasets from modern weather stations [60,61]. Monthly total precipitation in Inner Mongolia and Mongolia shows a significantly positive trend compared to the reference period 2001–2020 [11,83]. Palaeoclimate show a tendency towards greater annual variation (Figure 6). As expected from global climate change models [84,85,86,87], the reconstructed temperature increased significantly during the past 500 years and particularly during the period 2001–2020. Reconstructed streamflow runoff in Mongolia is connected to the precipitation variability, and an increase in rainfall triggered peaks in runoff totals. However, there is no negative trend in river runoff during the past 400 years. It is particularly striking that the year 1688, which marks the peak of the Maunder Minimum of the LIA, can be characterized as an exceptionally cold and dry year compared to the long-term average. The period 1675 to 1715, which is characterized by a sunspot minimum and decreased solar activity, is clearly visible in the temperature reconstruction from the tree-ring width and peaks around 1700 [65]. The minimum could have affected the East Asian Summer Monsoon (EASM) according to the 11-year solar cycle [88,89]. The precipitation records of Urgun Nars [7] show a negative trend during the Maunder Minimum, pointing towards decreased humidity transport into semi-arid and arid Mongolia caused by a potential decline and a southward shift of the EASM [90,91].
3.2. Modern Climatic and Surface Transformation Processes
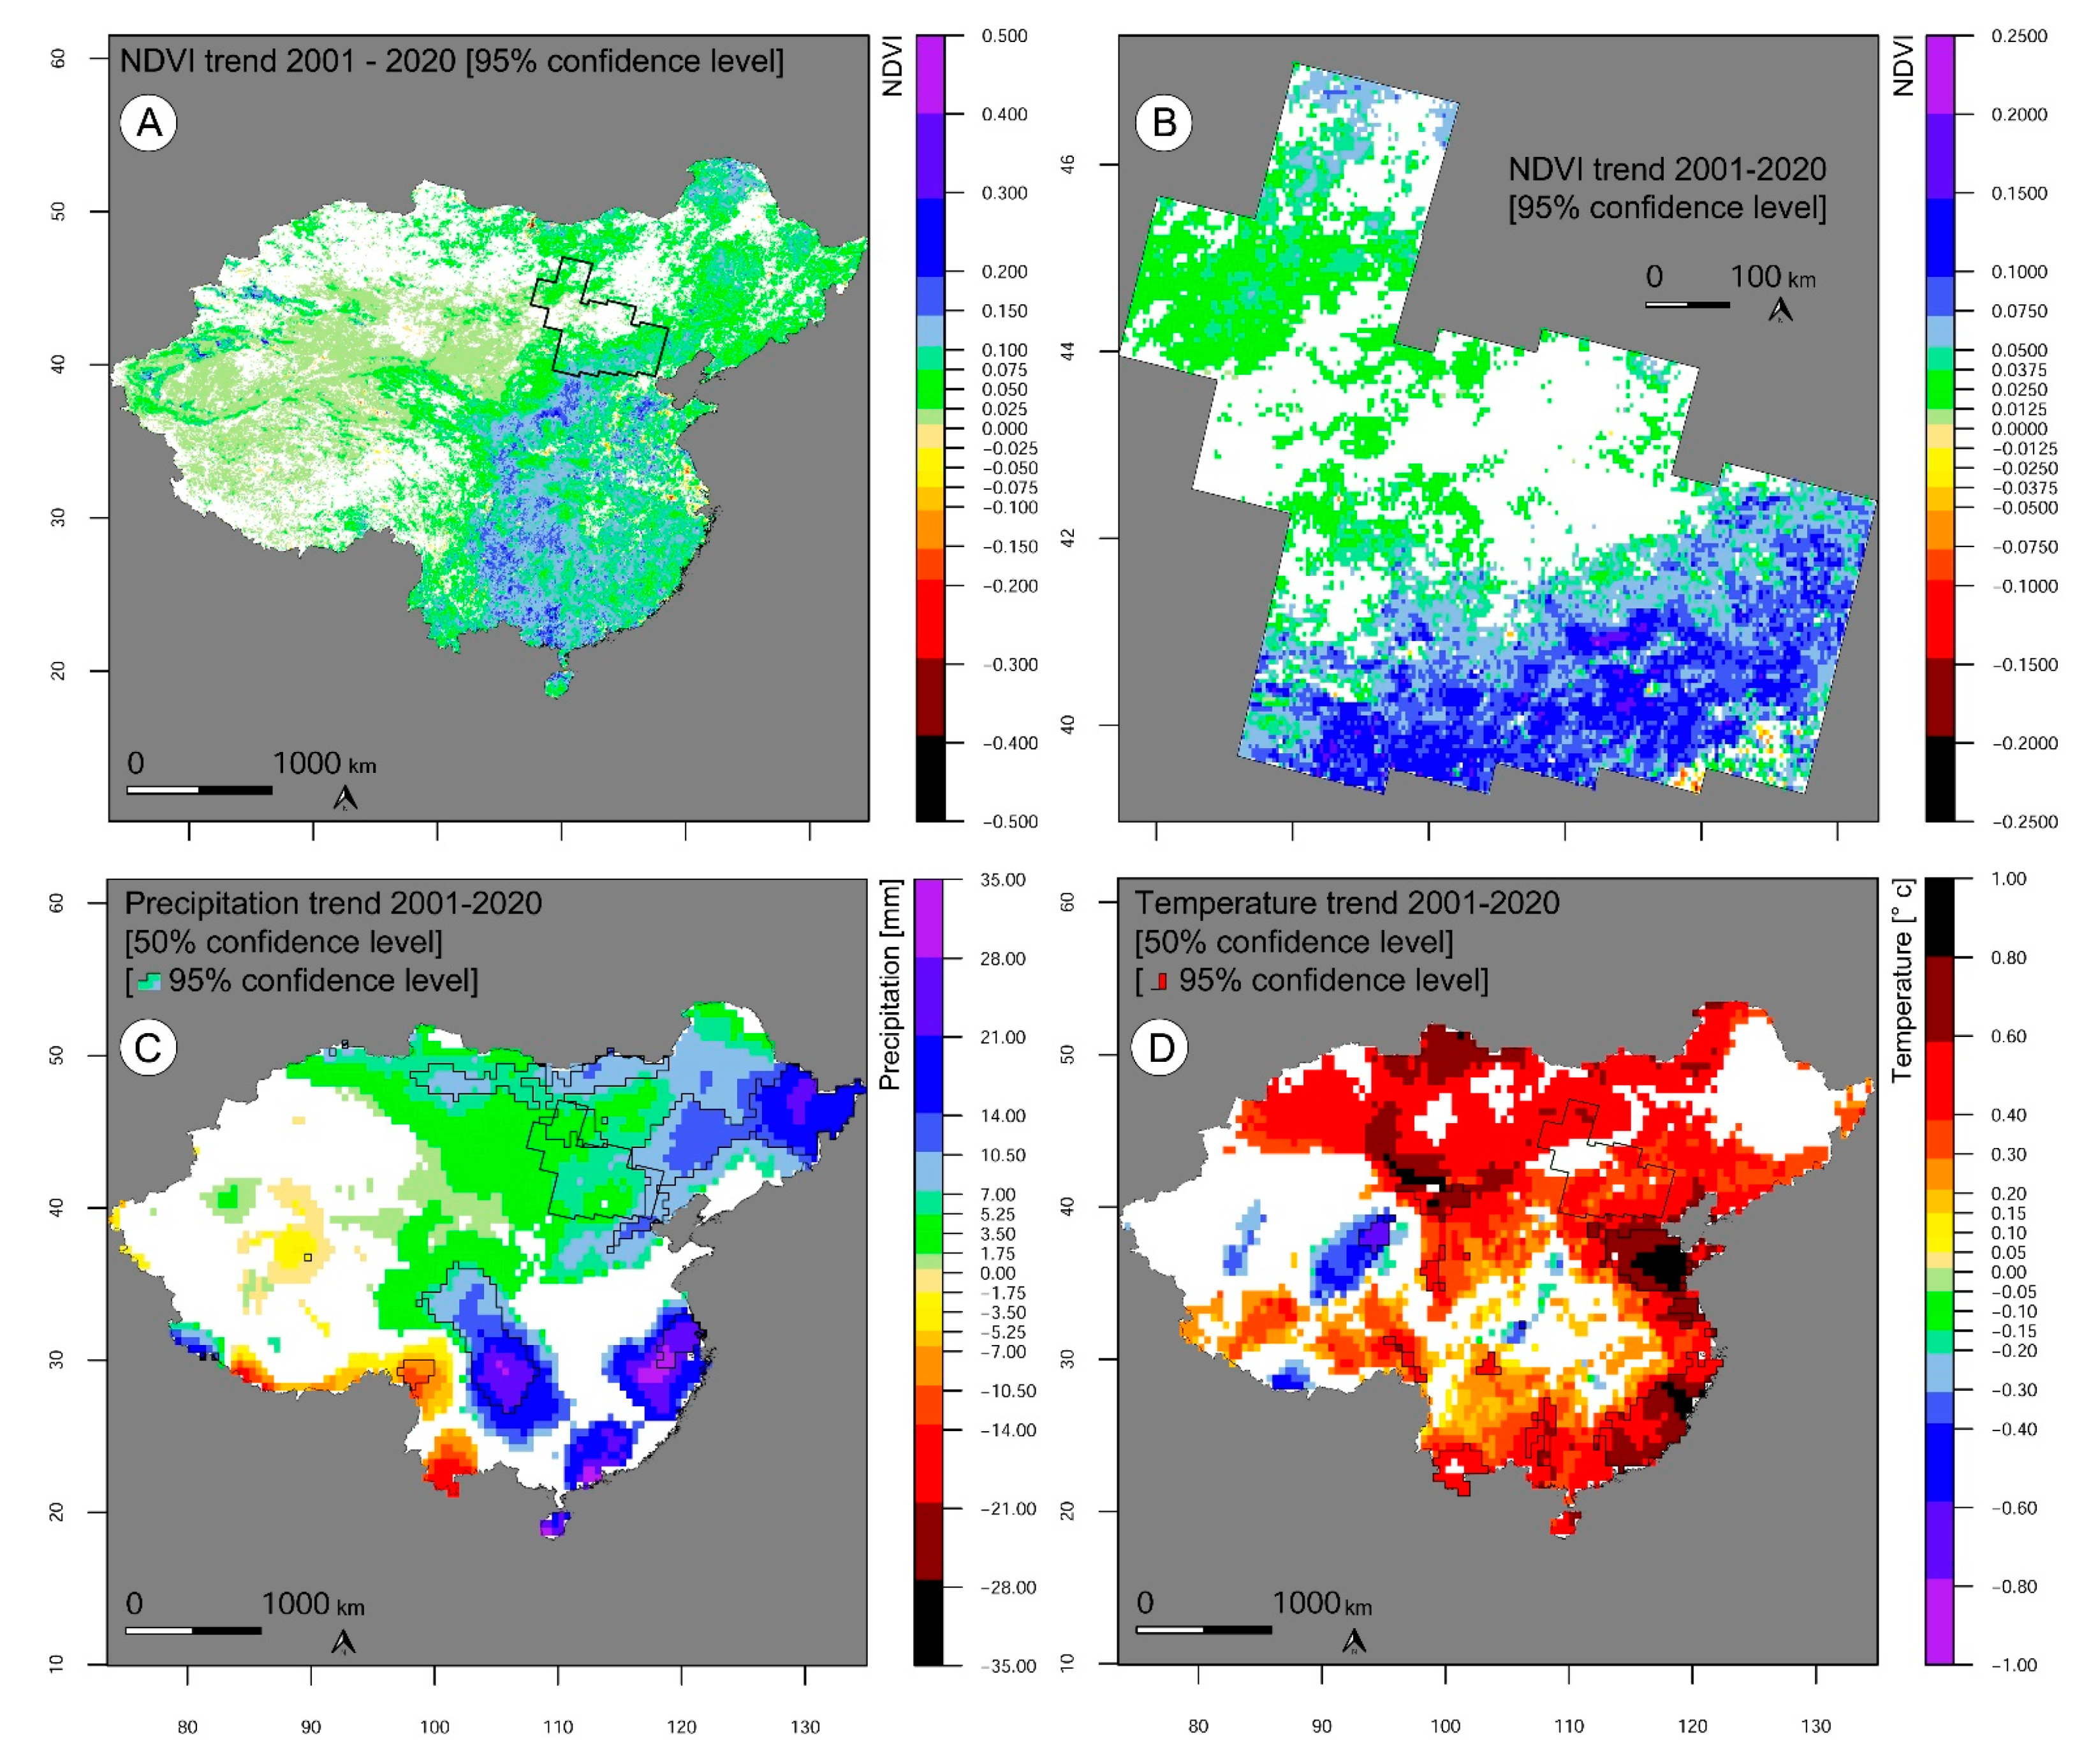
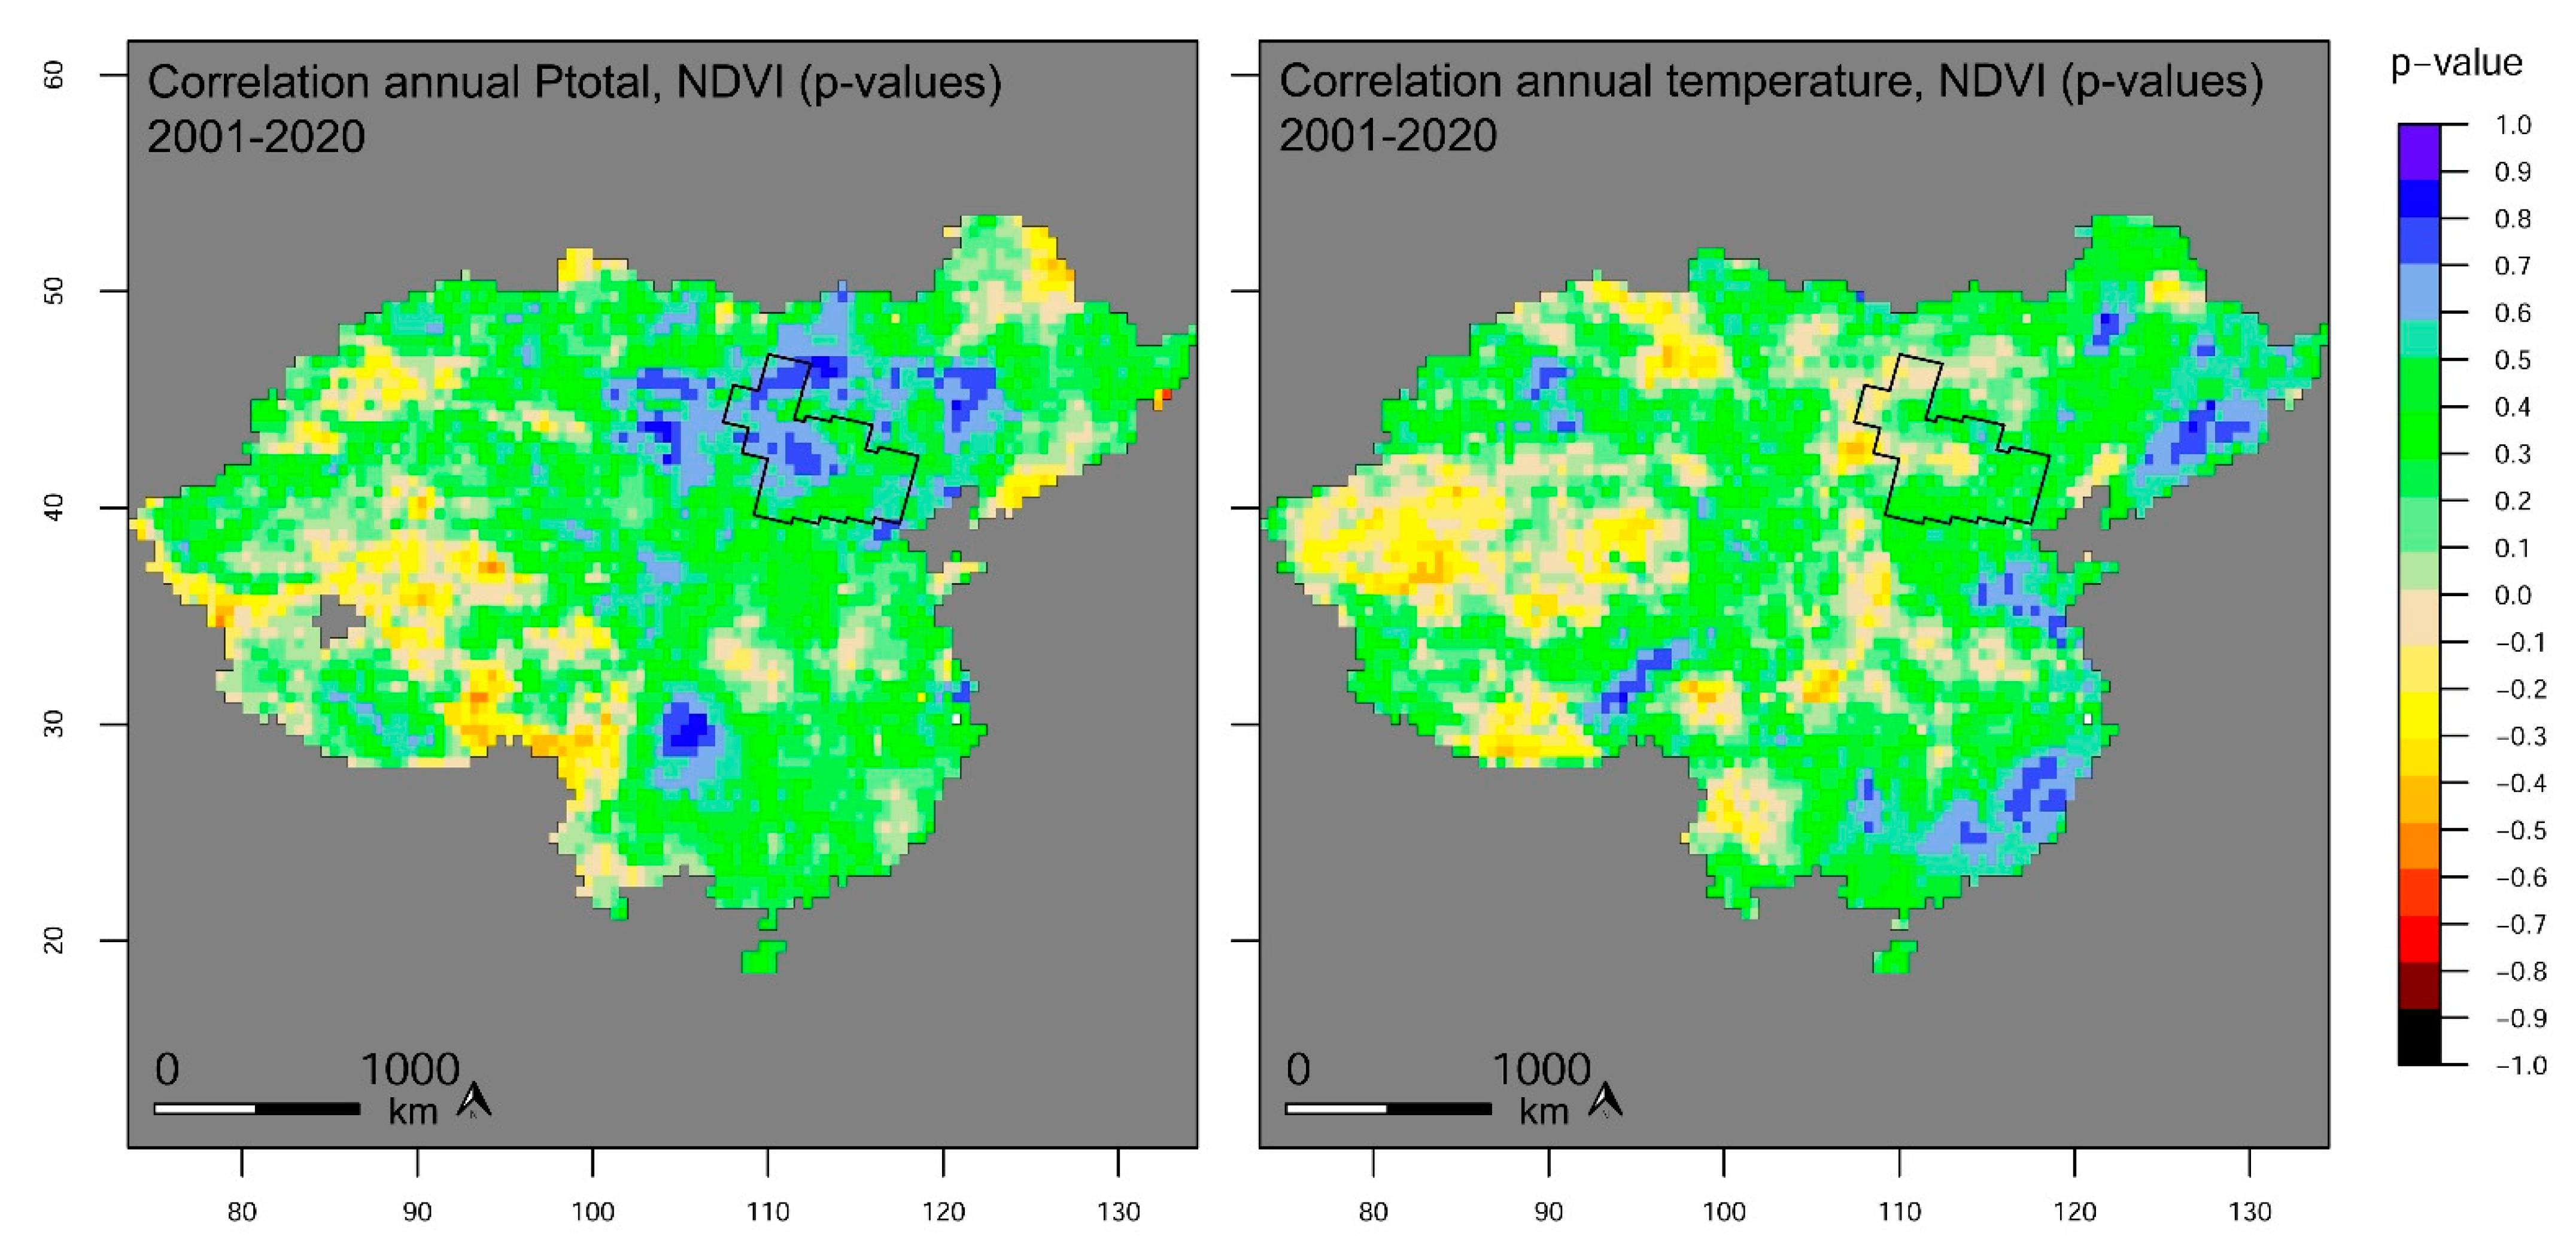
Modern NDVI time series were used to monitor vegetation canopy changes and surface transformations linked to climate change and anthropogenic overstraining. Vegetation indices of subsequent months and years and on various spatial scales allow for temporal in-depth observations of physical plant behavior or drought periods and are a common tool in remote sensing of ecological and climatic processes [92,93,94,95,96,97]. As derived from the Copernicus landcover data and the aridity index, the north-western parts of China and Mongolia reveal significantly low plant physiological activity and bare and sandy areas. This accounts for most of the transitional zone between China and Mongolia. The long-term MODIS NDVI temporal series from 2000–2020 show a significantly positive trend in spectral greening in most regions across China and Mongolia (Figure 7 and Figure 8). Particularly, the early growing season is the most important period to determine vegetation dynamics [71,98]. According to Ren et al. (2012), who highlighted the variability of rainfall and temperature as the most important driving factor of vegetation dynamics in Inner Mongolia, the results from the NDVI trend analyses confirm the strong relationship between precipitation development and vegetation response over China and Mongolia (Figure 9). Temperature increased significantly in the study area during the past two decades [99] and a positive trend in multiannual variation has been observed in precipitation totals [100]. In this context, Tong et al. (2017) reported from the eastern part of Inner Mongolia, where NDVI values increased between 1984 and 2013. The correlation between NDVI and precipitation and NDVI and temperature in the study area, which is most-likely connected to seasonal variation in precipitation totals in eastern Inner Mongolia and the annual cycle, can be confirmed for the period 2001–2020 (Figure 9) [15,99,100,101].
3.3. Vegetation Response to Anthropogenic Surface Transformation
These results contribute to the discussion about the complexity of aboveground net primary productivity (ANPP) in grasslands and annual, interannual, seasonal, and previous-year precipitation variability as reported from Inner Mongolia and North America shortgrass steppe [96,102,103,104,105,106,107]. There is a stronger spatial gradient of the sensitivity to and the relationship between precipitation and maximum temperature in desert steppe vegetation than in the subhumid forest zones [106,108,109]. This could highlight the anthropogenically induced origin of local desertification processes through grazing activity after the growing season, which amplified the vulnerability and decreased the resilience to global climate change of Inner Mongolia’s grassland and steppe vegetation [109,110]. Grazing activity in Inner Mongolia’s grasslands temporally peaks from July to September, when plant growth terminates [98]. As seen from the MODIS trend analysis, there is a clear trend towards vegetation recovery, linked to higher precipitation totals and an increase in temperature. An increasing temperature during the early growing season would therefore advance the spring phenological phases; however, decreased soil moisture would delay them [111].
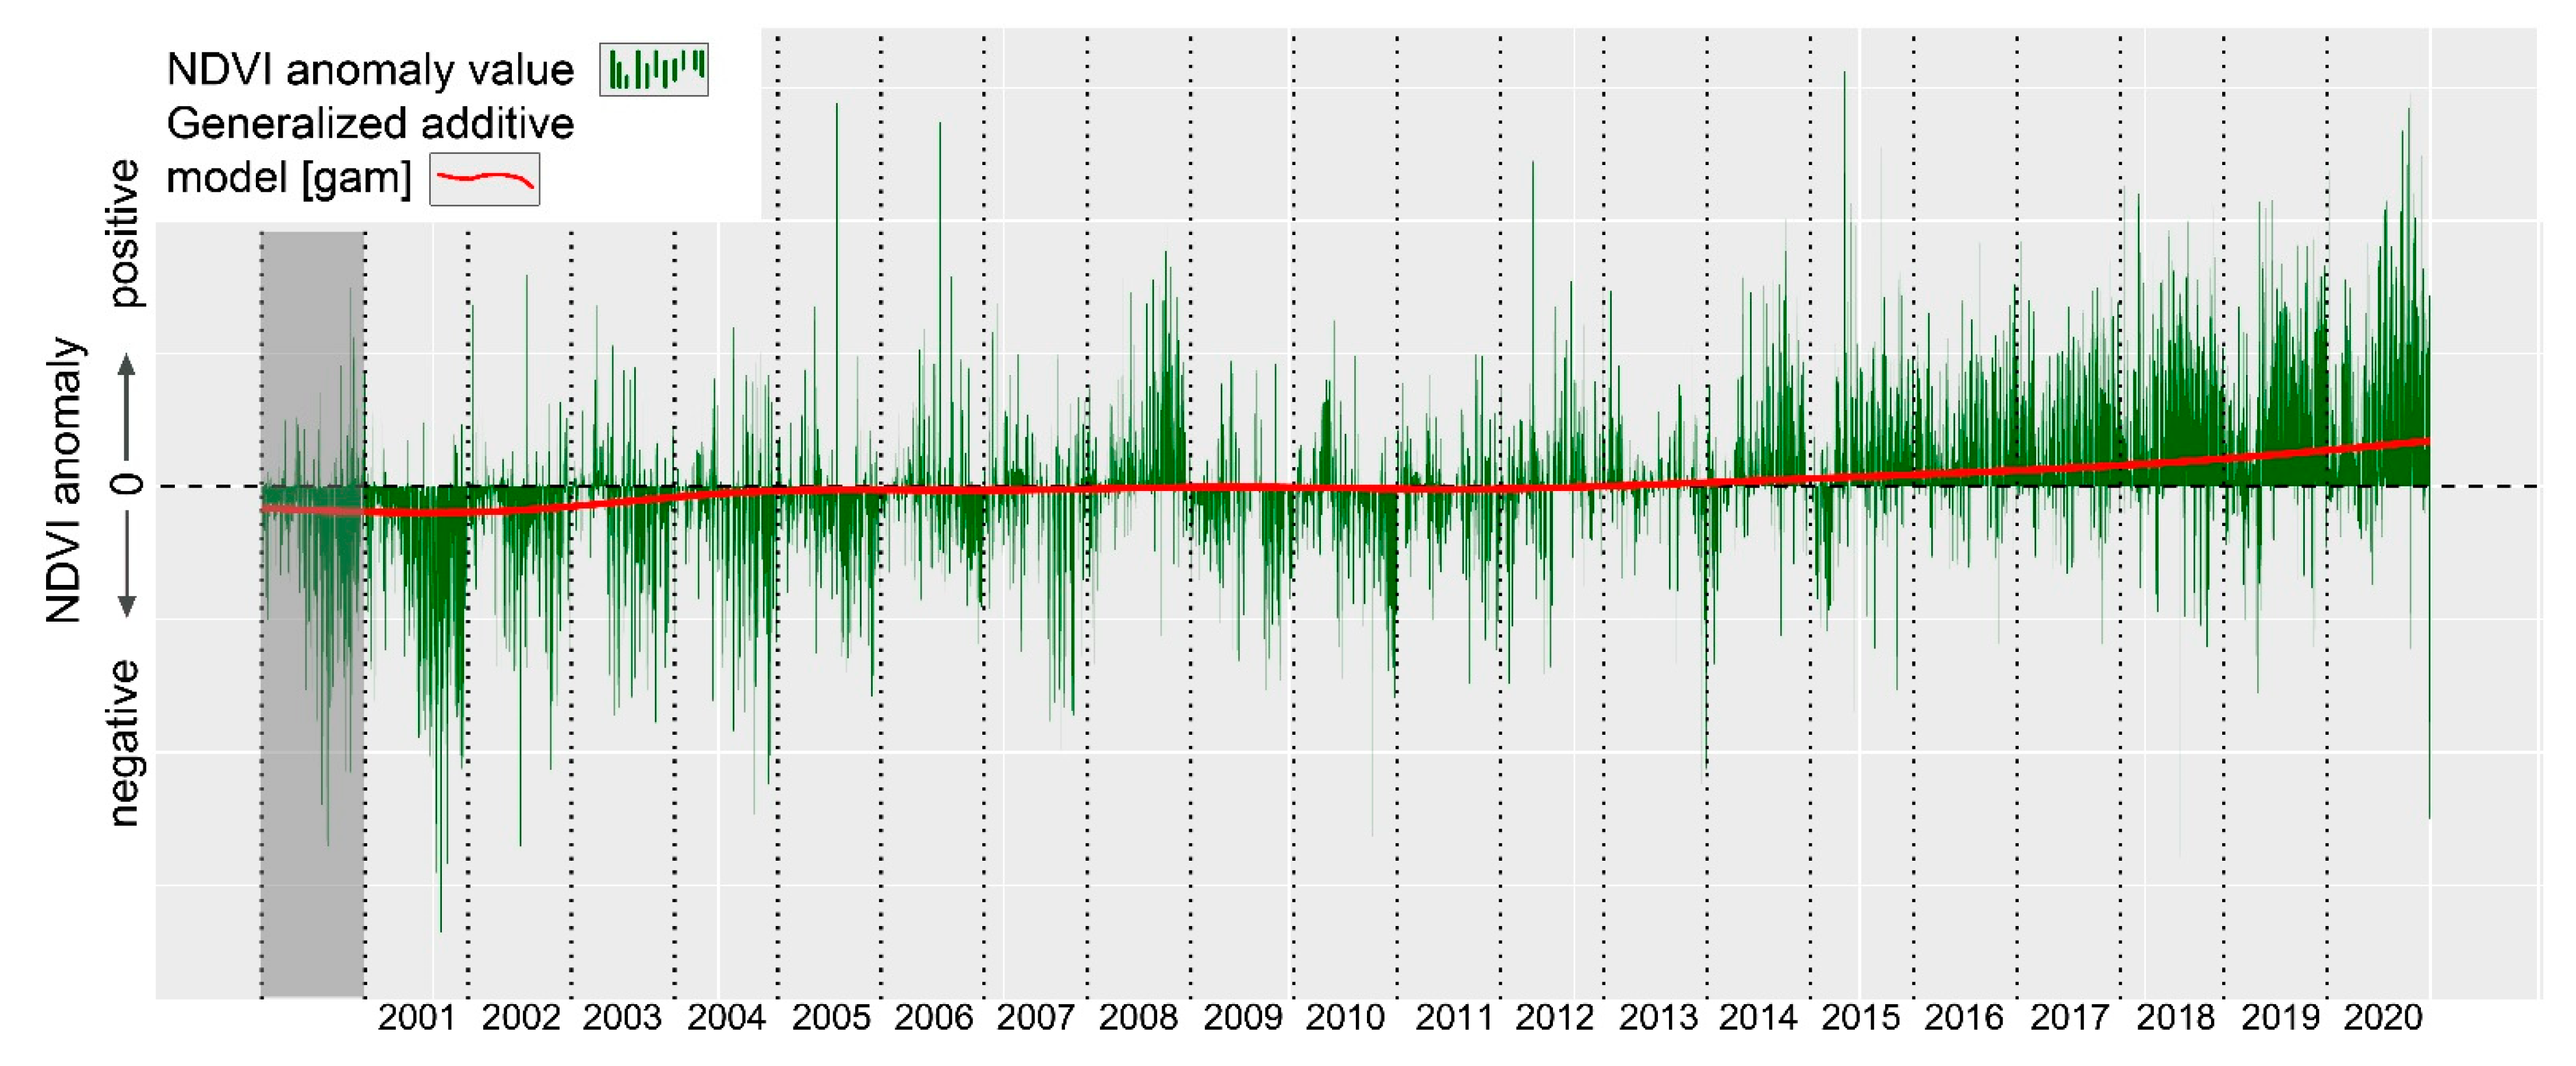
Recent articles have shown that land degradation has reduced considerably during the past 20 years and that desert extent reduction is not primarily caused by a reduction in human grazing activity but rather by an increase in precipitation [112]. Guo et al. (2020) reported a decrease in active desertification; however, this is mostly restricted to the more sub-humid northern part of Mongolia and the eastern parts of Inner Mongolia and does not totally affect the transitional zone between Inner Mongolia’s and Mongolia’s grasslands [112]. Cao et al. (2019; 2018a; 2018b) reported significantly reduced numbers of livestock in the Qinghai-Tibetan Plateau between 2001 and 2013 as a result of China’s livestock reduction policy and that grazing activity cannot solely be considered the trigger of extensive grassland degradation [11]. The authors furthermore point out that, due to market development, industrialization, population dynamics, and socio-cultural and socio-political transformation processes, the feedbacks of climate change, anthropogenic overprint, and land degradation are manifold and thoroughly interwoven [11,113,114]. Land degradation in northern China has increased constantly since the 1950s and peaked during the 1970s and 1980s and again until the beginning of the 21st century after when it decreased continuously [25,70]. According to Fang et al. (2021), the grassland productivity can be considered stable at least since 2009 [97]. From the anomaly model (Figure 8), a clear trend towards positive vegetation growth behavior can be observed since 2015 and the anomaly raster maps for the period 2015–2020 show significant trends to overall positive vegetation feedback compared to the reference period 2000–2020 (see the Supplementary Materials to this article). The raster trend analysis shows similar results for the extensive grasslands. However, large parts do not show significant vegetation trends.
There is ongoing debate about whether desertification processes are caused by anthropogenic overstraining and particularly overgrazing activity or by climate change phenomena [108,112,115,116]. Climate change and natural response cycles have been determined to trigger land degradation and the human impact caused extensive desertification at variable scales. The complexity of human-natural global change and the feedbacks are particularly visible in semi-arid climate-sensitive areas of Earth, where strong local anthropogenic impacts on short temporal scales have led to massively increased mobility of both humans and livestock after surface transformation and consequently the degradation of neighboring boundary zones [70]. This has led to a rapid decrease of the ecosystem’s functionality and landscape connectivity and enhances surface degradation through aeolian processes and dust accumulation. Subsequent dry years, hot drought phenomena, and rising temperatures during the early growing season and summer can further strengthen the vulnerability of the steppe grassland in northern China, despite a temporal increase in physical plant condition [117,118,119].
The results presented in this article show that over the entire study area, there is a significant increase in spectral greening and interannual vegetation variability, which is correlated to an increase in precipitation and temperature. These results show that decreasing grassland degradation during the 21st century can be related to climate change and increasing precipitation. Consequently, during a period of decreased precipitation totals and temperature, land degradation is supposed to advance significantly, as can be seen from the evaluation of the historical written sources and the reconstructed surface conditions during the 17th century in the study area. This points towards the climate-sensitive ecosystem functionalities of the grasslands at the transition zone from Northern China’s Inner Mongolia Autonomous Region to Mongolia and the vulnerability of the region to intensified anthropogenic impact. The historical data not only highlights the rapidly decreasing ecosystem resilience during the Little Ice Age but also how sensitive the region is to a strongly increasing number of livestock and changing socio-cultural and socio-political parameters and agendas [120]. Under recent climate change and regionally increasing heavy precipitation events and precipitation totals, grassland recovery and expansion could probably have been initiated earlier in the 20th century. However, the development was significantly delayed by strongly increased numbers of livestock and political influence in the region during the second half of the last century. The subsequent governmental restrictions to combat (human-induced) desertification processes in the region have eventually demonstrated success only since about 2015.
4. Conclusions
Northern China’s and Mongolia’s climate sensitive semi-arid regions experienced severe desertification during the 20th century, mostly linked to massively intensified livestock grazing activity, resource exploitation, and agricultural crop production, which increased water consumption and enhanced surface erosion. During the past decades, however, China’s policy-driven decision-making processes pushed local to regional programs to prevent land degradation and stabilize sandy areas and grasslands in order to decrease the potential of future soil erosion, surface transformation, and dust transport—a crucial factor, particularly in the context of Beijing’s high vulnerability to increased numbers of sandstorms. The actual cause and effect of desertification processes, however, is still heavily debated and it is yet unsolved whether local surface transformations are triggered by regional climate change feedbacks or whether they are connected to anthropogenically induced system transformation and governmental decision-making. It is a matter of fact that both are rooted in the human impact on the landscape functionalities, and land degradation and desertification mirror only the ultimate collapse and loss of resilience to withstand enhanced climatic or human pressure. From the results presented here, a strong relationship between environmental change and land degradation processes can be derived. This questions the recent impact of livestock grazing on the semi-arid regions of northern China and southern Mongolia. No negative trend in land degradation is seen from the long-term NDVI time series, but a significant increase in spectral greening and positive vegetation growth anomalies between 2000 and 2020. China’s government sought to restore extensive grasslands to maintain the regional population and one of the Earth’s largest and growing livestock. In the future, however, increasing seasonal variability in precipitation and significantly increasing temperature and drought risk during the growing season could re-enhance the climatic pressure on semi-arid landscapes and thus negatively affect grassland development.
To evaluate modern landcover transformation, historical climatological analysis and hermeneutics were merged with long-term palaeoenvironmental data. Documentary sources were used to reconstruct surface transformation and climate development during the LIA and to compare 17th century land degradation processes to modern desertification trends in semi-arid northern China and Mongolia. For this reason, written sources from 1688 were evaluated to extract a temporal series of landcover conditions for the period May to October 1688, a year that falls into a period of reduced sunspot activity and solar energy flux during the LIA. Palaeoenvironmental proxy have shown that precipitation and temperature records decreased during the Maunder Minimum (1675 to 1715 AD). 1688 is reported to peak with extreme climatic conditions by tree-ring-width and stalagmite composition analyses. According to written sources, the year was characterized by extremely low temperatures during the late grazing season of September and the onset of October and extremely dry conditions and severely high temperatures during the summer rainy season, which caused massive livestock perish in the region. Even though the evaluation of hermeneutically deduced historical environmental data remains strongly subjective, it represents an additional source to measure the dimension of human landcover change on the long-term scale. This is particularly important in grasslands and steppe vegetation areas, which are the Earth’s most climate-sensitive resources.
Supplementary Materials
The following are available online at https://www.mdpi.com/article/10.3390/land11010100/s1, Figure S1: NDVI anomalies.
Author Contributions
Research design, analyses, and writing: M.K. All authors have read and agreed to the published version of the manuscript.
Funding
This research received funding from the European Union, Operational Programme Research, Development and Education—Project, “Postdoc2MUNI” (No. CZ.02.2.69/0.0/0.0/18_053/0016952), Masaryk University, Brno, Czech Republic.
Institutional Review Board Statement
Not applicable.
Informed Consent Statement
Not applicable.
Data Availability Statement
All data underlying this article are publicly available on the internet.
Acknowledgments
I would like to thank two reviewers for their constructive critics.
Conflicts of Interest
The author declares no conflict of interest.
References
- UN. United Nations Convention to Combat Desertification in Countries Experiencing Serious Drought and/or Desertification, Particularly in Africa; Document A/AC. 241/27, 12. 09. 1994 with Annexes; United Nations: New York, NY, USA, 1994. [Google Scholar]
- UNCCD. Land Degradation Neutrality Reports 2019–2020; UN: Bonn, Germany, 2020. [Google Scholar]
- Cowie, A.L.; Penman, T.D.; Gorissen, L.; Winslow, M.D.; Lehmann, J.; Tyrrell, T.D.; Twomlow, S.; Wilkes, A.; Lal, R.; Jones, J.W.; et al. Towards sustainable land management in the drylands: Scientific connections in monitoring and assessing dryland degradation, climate change and biodiversity. Land Degrad. Dev. 2011, 22, 248–260. [Google Scholar] [CrossRef]
- Vogt, J.V.; Safriel, U.; von Maltitz, G.; Sokona, Y.; Zougmore, R.; Bastin, G.; Hill, J. Monitoring and assessment of land degradation and desertification: Towards new conceptual and integrated approaches. Land Degrad. Dev. 2011, 22, 150–165. [Google Scholar] [CrossRef]
- Herrmann, S.M.; Hutchinson, C.F. The changing contexts of the desertification debate. J. Arid Environ. 2005, 63, 538–555. [Google Scholar] [CrossRef]
- Zhao, H.-L.; Zhao, X.-Y.; Zhou, R.-L.; Zhang, T.-H.; Drake, S. Desertification processes due to heavy grazing in sandy rangeland, Inner Mongolia. J. Arid Environ. 2005, 62, 309–319. [Google Scholar] [CrossRef]
- Pederson, N.; Jacoby, G.C.; D’Arrigo, R.D.; Cook, E.R.; Buckley, B.M.; Dugarjav, C.; Mijiddorj, R. Hydrometeorological Reconstructions for Northeastern Mongolia Derived from Tree Rings: 1651–1995. J. Clim. 2001, 14, 872–881. [Google Scholar] [CrossRef]
- Burrell, A.L.; Evans, J.P.; de Kauwe, M.G. Anthropogenic climate change has driven over 5 million km2 of drylands towards desertification. Nat. Commun. 2020, 11, 3853. [Google Scholar] [CrossRef] [PubMed]
- Lin, Y.; Han, G.; Zhao, M.; Chang, S.X. Spatial vegetation patterns as early signs of desertification: A case study of a desert steppe in Inner Mongolia, China. Landsc. Ecol. 2010, 25, 1519–1527. [Google Scholar] [CrossRef]
- Aguiar, M.R.; Sala, O.E. Patch structure, dynamics and implications for the functioning of arid ecosystems. Trends Ecol. Evol. 1999, 14, 273–277. [Google Scholar] [CrossRef]
- Cao, J.; Adamowski, J.F.; Deo, R.C.; Xu, X.; Gong, Y.; Feng, Q. Grassland Degradation on the Qinghai-Tibetan Plateau: Reevaluation of Causative Factors. Rangel. Ecol. Manag. 2019, 72, 988–995. [Google Scholar] [CrossRef]
- Geist, H.J.; Lambin, E.F. Dynamic Causal Patterns of Desertification. BioScience 2004, 54, 817. [Google Scholar] [CrossRef] [Green Version]
- Conte, T.J.; Tilt, B. The Effects of China’s Grassland Contract Policy on Pastoralists’ Attitudes towards Cooperation in an Inner Mongolian Banner. Hum. Ecol. 2014, 42, 837–846. [Google Scholar] [CrossRef]
- Taylor, J.L. Negotiating the Grassland: The Policy of Pasture Enclosures and Contested Resource Use in Inner Mongolia. Hum. Organ. 2006, 65, 374–386. [Google Scholar] [CrossRef]
- Guo, E.; Wang, Y.; Wang, C.; Sun, Z.; Bao, Y.; Mandula, N.; Jirigala, B.; Bao, Y.; Li, H. NDVI Indicates Long-Term Dynamics of Vegetation and Its Driving Forces from Climatic and Anthropogenic Factors in Mongolian Plateau. Remote Sens. 2021, 13, 688. [Google Scholar] [CrossRef]
- Weber, K.T.; Horst, S. Desertification and livestock grazing: The roles of sedentarization, mobility and rest. Pastor. Res. Policy Pract. 2011, 1, 19. [Google Scholar] [CrossRef] [Green Version]
- Glaser, R.; Kahle, M. Reconstructions of droughts in Germany since 1500–combining hermeneutic information and instrumental records in historical and modern perspectives. Clim. Past 2020, 16, 1207–1222. [Google Scholar] [CrossRef]
- Cincotta, R.P.; Yanqing, Z.; Xingmin, Z. Transhumant Alpine Pastoralism in Northeastern Qinghai Province: An Evaluation of Livestock Population Response during China’s Agrarian Economic Reform. Nomadic Peoples 1992, 30, 3–25. [Google Scholar]
- Jordan, G.; Goenster, S.; Munkhnasan, T.; Shabier, A.; Buerkert, A.; Schlecht, E. Spatio-temporal patterns of herbage availability and livestock movements: A cross-border analysis in the Chinese-Mongolian Altay. Pastor. Res. Policy Pract. 2016, 6, 12. [Google Scholar] [CrossRef]
- Glindemann, T.; Wang, C.; Tas, B.M.; Schiborra, A.; Gierus, M.; Taube, F.; Susenbeth, A. Impact of grazing intensity on herbage intake, composition, and digestibility and on live weight gain of sheep on the Inner Mongolian steppe. Livest. Sci. 2009, 124, 142–147. [Google Scholar] [CrossRef]
- Wu, J.; Zhang, Q.; Li, A.; Liang, C. Historical landscape dynamics of Inner Mongolia: Patterns, drivers, and impacts. Landsc. Ecol. 2015, 30, 1579–1598. [Google Scholar] [CrossRef]
- Neupert, R.F. Population, Nomadic Pastoralism and the Environment in the Mongolian Plateau. Popul. Environ. 1999, 20, 413–441. [Google Scholar] [CrossRef]
- Zhang, Y.; Wang, Q.; Wang, Z.; Yang, Y.; Li, J. Impact of human activities and climate change on the grassland dynamics under different regime policies in the Mongolian Plateau. Sci. Total Environ. 2020, 698, 134304. [Google Scholar] [CrossRef]
- Zhang, H.; Fan, J.; Cao, W.; Harris, W.; Li, Y.; Chi, W.; Wang, S. Response of wind erosion dynamics to climate change and human activity in Inner Mongolia, China during 1990 to 2015. Sci. Total Environ. 2018, 639, 1038–1050. [Google Scholar] [CrossRef]
- Xue, Z.; Kappas, M.; Wyss, D. Spatio-Temporal Grassland Development in Inner Mongolia after Implementation of the First Comprehensive Nation-Wide Grassland Conservation Program. Land 2021, 10, 38. [Google Scholar] [CrossRef]
- Cao, J.; Yeh, E.T.; Holden, N.M.; Qin, Y.; Ren, Z. The Roles of Overgrazing, Climate Change and Policy as Drivers of Degradation of China’s Grasslands. Nomadic Peoples 2013, 17, 82–101. [Google Scholar] [CrossRef]
- Harris, R.B. Rangeland degradation on the Qinghai-Tibetan plateau: A review of the evidence of its magnitude and causes. J. Arid Environ. 2010, 74, 1–12. [Google Scholar] [CrossRef]
- Kakinuma, K.; Okayasu, T.; Sasaki, T.; Jamsaran, U.; Okuro, T.; Takeuchi, K. Rangeland management in highly variable environments: Resource variations across the landscape mediate the impact of grazing on vegetation in Mongolia. Grassl. Sci. 2013, 59, 44–51. [Google Scholar] [CrossRef]
- Zhang, C.; Xia, W.; Luan, X.; Zhuang, H.; Khan, T.U.; Zhang, G.; Wu, S. Use of historical data to assess the impact of climate change and anthropogenic disturbance on the black-billed capercaillie (Tetrao urogalloides) in northeast China. Glob. Ecol. Conserv. 2020, 22, e00972. [Google Scholar] [CrossRef]
- Eddy, J.A. The Maunder Minimum. Science 1976, 192, 1189–1202. [Google Scholar] [CrossRef] [PubMed] [Green Version]
- Shindell, D.T.; Schmidt, G.A.; Mann, M.E.; Rind, D.; Waple, A. Solar forcing of regional climate change during the Maunder Minimum. Science 2001, 294, 2149–2152. [Google Scholar] [CrossRef] [Green Version]
- Lean, J. Evolution of the Sun’s Spectral Irradiance Since the Maunder Minimum. Geophys. Res. Lett. 2000, 27, 2425–2428. [Google Scholar] [CrossRef] [Green Version]
- Eddy, J.A. The Maunder Minimum: A reappraisal. Sol. Phys. 1983, 89, 195–207. [Google Scholar] [CrossRef]
- Luterbacher, J.; Rickli, R.; Xoplaki, E.; Tinguely, C.; Beck, C.; Pfister, C.; Wanner, H. The Late Maunder Minimum (1675–1715)—A Key Period for Studying Decadal Scale Climatic Change in Europe. Clim. Chang. 2001, 49, 441–462. [Google Scholar] [CrossRef]
- Usoskin, I.; Solanki, S.K.; Krivova, N.; Hofer, B.; Kovaltsov, G.A.; Wacker, L.; Brehm, N.; Kromer, B. Solar cyclic activity over the last millennium reconstructed from annual 14C data. Astron. Astrophys. 2021, 649, A141. [Google Scholar] [CrossRef]
- Dorward, P.; Osbahr, H.; Sutcliffe, C.; Mbeche, R. Supporting climate change adaptation using historical climate analysis. Clim. Dev. 2020, 12, 469–480. [Google Scholar] [CrossRef] [Green Version]
- Blöschl, G.; Kiss, A.; Viglione, A.; Barriendos, M.; Böhm, O.; Brázdil, R.; Coeur, D.; Demarée, G.; Llasat, M.C.; Macdonald, N.; et al. Current European flood-rich period exceptional compared with past 500 years. Nature 2020, 583, 560–566. [Google Scholar] [CrossRef]
- Erfurt, M.; Skiadaresis, G.; Tijdeman, E.; Blauhut, V.; Bauhus, J.; Glaser, R.; Schwarz, J.; Tegel, W.; Stahl, K. A multidisciplinary drought catalogue for southwestern Germany dating back to 1801. Nat. Hazards Earth Syst. Sci. 2020, 20, 2979–2995. [Google Scholar] [CrossRef]
- Erfurt, M.; Glaser, R.; Blauhut, V. Changing impacts and societal responses to drought in southwestern Germany since 1800. Reg. Environ. Chang. 2019, 19, 2311–2323. [Google Scholar] [CrossRef] [Green Version]
- Struck, J.; Bliedtner, M.; Strobel, P.; Schumacher, J.; Bazarradnaa, E.; Zech, R. Leaf wax n-alkane patterns and compound-specific δ13C of plants and topsoils from semi-arid and arid Mongolia. Biogeosciences 2020, 17, 567–580. [Google Scholar] [CrossRef] [Green Version]
- Angerer, J.; Han, G.; Fujisaki, I.; Havstad, K. Climate Change and Ecosystems of Asia with Emphasis on Inner Mongolia and Mongolia. Rangelands 2008, 30, 46–51. [Google Scholar] [CrossRef] [Green Version]
- Suzuki, Y. Conflict Between Mining Development and Nomadism in Mongolia. In The Mongolian Ecosystem Network; Yamamura, N., Fujita, N., Maekawa, A., Eds.; Springer: Tokyo, Japan, 2013; pp. 269–294. ISBN 978-4-431-54051-9. [Google Scholar]
- Chen, J.; Huang, D.; Shiyomi, M.; Hori, Y.; Yamamura, Y.; Yiruhan. Spatial heterogeneity and diversity of vegetation at the landscape level in Inner Mongolia, China, with special reference to water resources. Landsc. Urban Plan. 2007, 82, 222–232. [Google Scholar] [CrossRef]
- Xiao, X.; Ojima, D.S.; Parton, W.J.; CHen, Z.; Chen, D. Sensitivity of Inner Mongolia Grasslands to Climate Change. J. Biogeogr. 1995, 22, 643–648. [Google Scholar] [CrossRef]
- Wang, J.; Brown, D.G.; Agrawal, A. Climate adaptation, local institutions, and rural livelihoods: A comparative study of herder communities in Mongolia and Inner Mongolia, China. Glob. Environ. Chang. 2013, 23, 1673–1683. [Google Scholar] [CrossRef]
- Mu, S.; Yang, H.; Li, J.; Chen, Y.; Gang, C.; Zhou, W.; Ju, W. Spatio-temporal dynamics of vegetation coverage and its relationship with climate factors in Inner Mongolia, China. J. Geogr. Sci. 2013, 23, 231–246. [Google Scholar] [CrossRef]
- Zhang, R.; Zhao, X.; Zuo, X.; Degen, A.A.; Li, Y.; Liu, X.; Luo, Y.; Qu, H.; Lian, J.; Wang, R. Drought-induced shift from a carbon sink to a carbon source in the grasslands of Inner Mongolia, China. CATENA 2020, 195, 104845. [Google Scholar] [CrossRef]
- Huang, J.; Xue, Y.; Sun, S.; Zhang, J. Spatial and temporal variability of drought during 1960–2012 in Inner Mongolia, north China. Quat. Int. 2015, 355, 134–144. [Google Scholar] [CrossRef]
- Pei, Z.; Fang, S.; Wang, L.; Yang, W. Comparative Analysis of Drought Indicated by the SPI and SPEI at Various Timescales in Inner Mongolia, China. Water 2020, 12, 1925. [Google Scholar] [CrossRef]
- Wang, L.; Wang, L.; Liu, Y.; Chen, W. The 2017–2018 Winter Drought in North China and Its Causes. Atmosphere 2019, 10, 60. [Google Scholar] [CrossRef] [Green Version]
- Trabucco, A.; Zomer, R. Global Aridity Index and Potential Evapotranspiration (ET0) Climate Database v2. CGIAR Consort Spat. Inf. 2018, 10. [Google Scholar] [CrossRef]
- Liu, Y.; Fang, X.; Dai, J.; Wang, H.; Tao, Z. Could phenological records from Chinese poems of the Tang and Song dynasties (618–1279 CE) be reliable evidence of past climate changes? Clim. Past 2021, 17, 929–950. [Google Scholar] [CrossRef]
- Watts, J. (Ed.) The General History of China: Containing a Geographical, Historical, Chronological, Political and Physical Description of the Empire of China, Chinese-Tartary, Corea and Thibet; Dr Jay Watts: London, UK, 1739. [Google Scholar]
- Herzog, I. Least-cost Paths–Some Methodological Issues. Internet Archaeol. 2014, 36. [Google Scholar] [CrossRef]
- Howey, M.C.L. Multiple pathways across past landscapes: Circuit theory as a complementary geospatial method to least cost path for modeling past movement. J. Archaeol. Sci. 2011, 38, 2523–2535. [Google Scholar] [CrossRef]
- Kempf, M. Paradigm and pragmatism: GIS-based spatial analyses of Roman infrastructure networks and land-use concepts in the Upper Rhine Valley. Geoarchaeology 2019, 34, 797–808. [Google Scholar] [CrossRef]
- Earth Resources Observation and Science (EROS) Center. Shuttle Radar Topography Mission (SRTM) 1 Arc-Second Global. 2017. Available online: https://www.usgs.gov/centers/eros/science/usgs-eros-archive-digital-elevation-shuttle-radar-topography-mission-srtm-1 (accessed on 5 January 2022).
- Buchhorn, M.; Smets, B.; Bertels, L.; de Roo, B.; Lesiv, M.; Tsendbazar, N.-E.; Herold, M.; Fritz, S. Copernicus Global Land Service: Land Cover 100m: Collection 3: Epoch 2019: Globe. 2020. Available online: https://zenodo.org/record/3939050#.YdkSPFkRVhE (accessed on 5 January 2022).
- Buchhorn, M.; Smets, B.; Bertels, L.; de Roo, B.; Lesiv, M.; Tsendbazar, N.-E.; Li, L.; Tarko, A. Copernicus Global Land Service: Land Cover 100m: Version 3 Globe 2015–2019: Product User Manual. 2020. Available online: https://zenodo.org/record/4723921#.YdkSVVkRVhE (accessed on 5 January 2022).
- Fick, S.E.; Hijmans, R.J. WorldClim 2: New 1-km spatial resolution climate surfaces for global land areas. Int. J. Clim. 2017, 37, 4302–4315. [Google Scholar] [CrossRef]
- University of East Anglia Climatic Research Unit; Harris, I.C.; Jones, P.D. CRU TS4.05: Climatic Research Unit (CRU) Time-Series (TS) Version 4.05 of High-Resolution Gridded Data of Month-by-Month Variation in Climate (Jan. 1901–Dec. 2020). 2021. Available online: https://catalogue.ceda.ac.uk/uuid/c26a65020a5e4b80b20018f148556681 (accessed on 5 January 2022).
- Didan, K. MOD13C2 MODIS/Terra Vegetation Indices Monthly L3 Global 0.05Deg CMG V006. 2015. Available online: https://lpdaac.usgs.gov/products/mod13c2v006/ (accessed on 5 January 2022).
- Technical University of Denmark. Global Wind Atlas 3.0: A Free, Web-Based Application Developed, Owned and Operated by the Technical University of Denmark (DTU). 2020. Available online: https://globalwindatlas.info/ (accessed on 5 January 2022).
- Cleveland, W.S. Robust Locally Weighted Regression and Smoothing Scatterplots. J. Am. Stat. Assoc. 1979, 74, 829–836. [Google Scholar] [CrossRef]
- Tan, M.; Liu, T.; Hou, J.; Qin, X.; Zhang, H.; Li, T. Cyclic rapid warming on centennial-scale revealed by a 2650-year stalagmite record of warm season temperature. Geophys. Res. Lett. 2003, 30, 1–4. [Google Scholar] [CrossRef]
- Davi, N.K.; Pederson, N.; Leland, C.; Nachin, B.; Suran, B.; Jacoby, G.C. Is eastern Mongolia drying? A long-term perspective of a multidecadal trend. Water Resour. Res. 2013, 49, 151–158. [Google Scholar] [CrossRef] [Green Version]
- Davi, N.K.; Jacoby, G.C.; Curtis, A.E.; Baatarbileg, N. Extension of Drought Records for Central Asia Using Tree Rings: West-Central Mongolia. J. Clim. 2006, 19, 288–299. [Google Scholar] [CrossRef]
- Yi, L.; Yu, H.; Xu, X.; Yao, J.; Su, Q.; Ge, J. Exploratory Precipitation in North-Central China during the Past Four Centuries. Acta Geol. Sin.-Engl. Ed. 2010, 84, 223–229. [Google Scholar] [CrossRef]
- Lemordant, L.; Gentine, P. Vegetation Response to Rising CO2 Impacts Extreme Temperatures. Geophys. Res. Lett. 2019, 46, 1383–1392. [Google Scholar] [CrossRef]
- Feng, L.; Jia, Z.; Li, Q. The dynamic monitoring of aeolian desertification land distribution and its response to climate change in northern China. Sci. Rep. 2016, 6, 39563. [Google Scholar] [CrossRef] [Green Version]
- Gong, Z.; Kawamura, K.; Ishikawa, N.; Goto, M.; Wulan, T.; Alateng, D.; Yin, T.; Ito, Y. MODIS normalized difference vegetation index (NDVI) and vegetation phenology dynamics in the Inner Mongolia grassland. Solid Earth 2015, 6, 1185–1194. [Google Scholar] [CrossRef] [Green Version]
- Cui, J.; Chang, H.; Burr, G.S.; Zhao, X.; Jiang, B. Climatic change and the rise of the Manchu from Northeast China during AD 1600–1650. Clim. Chang. 2019, 156, 405–423. [Google Scholar] [CrossRef]
- Chen, Q. Climate shocks, dynastic cycles and nomadic conquests: Evidence from historical China. Oxf. Econ. Pap. 2015, 67, 185–204. [Google Scholar] [CrossRef]
- Fan, P.; Chen, J.; John, R. Urbanization and environmental change during the economic transition on the Mongolian Plateau: Hohhot and Ulaanbaatar. Environ. Res. 2016, 144, 96–112. [Google Scholar] [CrossRef] [PubMed] [Green Version]
- Yu, D.; Zhou, L.; Zhou, W.; Ding, H.; Wang, Q.; Wang, Y.; Wu, X.; Dai, L. Forest management in Northeast China: History, problems, and challenges. Environ. Manag. 2011, 48, 1122–1135. [Google Scholar] [CrossRef]
- Hoffmann, C.; Funk, R.; Reiche, M.; Li, Y. Assessment of extreme wind erosion and its impacts in Inner Mongolia, China. Aeolian Res. 2011, 3, 343–351. [Google Scholar] [CrossRef]
- Zhao, H.-L.; Yi, X.-Y.; Zhou, R.-L.; Zhao, X.-Y.; Zhang, T.-H.; Drake, S. Wind erosion and sand accumulation effects on soil properties in Horqin Sandy Farmland, Inner Mongolia. CATENA 2006, 65, 71–79. [Google Scholar] [CrossRef]
- Li, F.-R.; Kang, L.-F.; Zhang, H.; Zhao, L.-Y.; Shirato, Y.; Taniyama, I. Changes in intensity of wind erosion at different stages of degradation development in grasslands of Inner Mongolia, China. J. Arid Environ. 2005, 62, 567–585. [Google Scholar] [CrossRef]
- Jiang, L.; Xiao, Y.; Zheng, H.; Ouyang, Z. Spatio-temporal variation of wind erosion in Inner Mongolia of China between 2001 and 2010. Chin. Geogr. Sci. 2016, 26, 155–164. [Google Scholar] [CrossRef] [Green Version]
- Guo, J.; Rahn, K.A.; Zhuang, G. A mechanism for the increase of pollution elements in dust storms in Beijing. Atmos. Environ. 2004, 38, 855–862. [Google Scholar] [CrossRef]
- Hu, W.; Niu, H.; Zhang, D.; Wu, Z.; Chen, C.; Wu, Y.; Shang, D.; Hu, M. Insights into a dust event transported through Beijing in spring 2012: Morphology, chemical composition and impact on surface aerosols. Sci. Total Environ. 2016, 565, 287–298. [Google Scholar] [CrossRef] [PubMed]
- Yang, X.; Xu, B.; Jin, Y.; Qin, Z.; Ma, H.; Li, J.; Zhao, F.; Chen, S.; Zhu, X. Remote sensing monitoring of grassland vegetation growth in the Beijing–Tianjin sandstorm source project area from 2000 to 2010. Ecol. Indic. 2015, 51, 244–251. [Google Scholar] [CrossRef]
- Zhang, Y.; Xu, X.; Liao, Z.; Han, Z.; Ji, G.; Liang, W.; Liu, T. Response of surface runoff to land use and land cover change and its impact on Daihai Lake shrinkage in Inner Mongolia, China. Appl. Clim. 2021, 144, 555–569. [Google Scholar] [CrossRef]
- Alverson, K.D.; Pedersen, T.F.; Bradley, R.S. (Eds.) Paleoclimate, Global Change and the Future; Springer: Berlin/Heidelberg, Germany, 2003; ISBN 978-3-642-55828-3. [Google Scholar]
- Esper, J.; Cook, E.R.; Schweingruber, F.H. Low-frequency signals in long tree-ring chronologies for reconstructing past temperature variability. Science 2002, 295, 2250–2253. [Google Scholar] [CrossRef] [Green Version]
- Jones, P.D.; Briffa, K.R.; Barnett, T.P.; Tett, S.F.B. High-resolution palaeoclimatic records for the last millennium: Interpretation, integration and comparison with General Circulation Model control-run temperatures. Holocene 1998, 8, 455–471. [Google Scholar] [CrossRef]
- Mann, M.E.; Bradley, R.S.; Hughes, M.K. Global-scale temperature patterns and climate forcing over the past six centuries. Nature 1998, 392, 779–787. [Google Scholar] [CrossRef]
- Chen, W.; Zhou, Q.; Xue, X. Solar cycle modulation of the relationship between the boreal spring Northern Atlantic Oscillation and the East and Southeast Asian summer climate. Meteorol. Atmos. Phys. 2020, 132, 287–295. [Google Scholar] [CrossRef]
- Zhang, J.; Zhou, X.; Jiang, S.; Tu, L.; Liu, X. Monsoon Precipitation, Economy and Wars in Ancient China. Front. Earth Sci. 2020, 8, 317. [Google Scholar] [CrossRef]
- Lan, J.; Xu, H.; Lang, Y.; Yu, K.; Zhou, P.; Kang, S.; Zhou, K.; Wang, X.; Wang, T.; Cheng, P.; et al. Dramatic weakening of the East Asian summer monsoon in northern China during the transition from the Medieval Warm Period to the Little Ice Age. Geology 2020, 48, 307–312. [Google Scholar] [CrossRef]
- Zeng, Y.; Chen, J.; Zhu, Z.; Li, J.; Wang, J.; Wan, G. The wet Little Ice Age recorded by sediments in Huguangyan Lake, tropical South China. Quat. Int. 2012, 263, 55–62. [Google Scholar] [CrossRef]
- Wei, B.; Xie, Y.; Wang, X.; Jiao, J.; He, S.; Bie, Q.; Jia, X.; Xue, X.; Duan, H. Land cover mapping based on time-series MODIS-NDVI using a dynamic time warping approach: A casestudy of the agricultural pastoral ecotone of northern China. Land Degrad. Dev. 2020, 31, 1050–1068. [Google Scholar] [CrossRef]
- Fensholt, R.; Proud, S.R. Evaluation of Earth Observation based global long term vegetation trends—Comparing GIMMS and MODIS global NDVI time series. Remote Sens. Environ. 2012, 119, 131–147. [Google Scholar] [CrossRef]
- Gu, J.; Li, X.; Huang, C.; Okin, G.S. A simplified data assimilation method for reconstructing time-series MODIS NDVI data. Adv. Space Res. 2009, 44, 501–509. [Google Scholar] [CrossRef]
- Kempf, M.; Glaser, R. Tracing Real-Time Transnational Hydrologic Sensitivity and Crop Irrigation in the Upper Rhine Area over the Exceptional Drought Episode 2018–2020 Using Open Source Sentinel-2 Data. Water 2020, 12, 3298. [Google Scholar] [CrossRef]
- Ren, S.; Yi, S.; Peichl, M.; Wang, X. Diverse Responses of Vegetation Phenology to Climate Change in Different Grasslands in Inner Mongolia during 2000–2016. Remote Sens. 2018, 10, 17. [Google Scholar] [CrossRef] [Green Version]
- Fang, X.; Wu, J.; He, C. Assessing human-environment system sustainability based on Regional Safe and Just Operating Space: The case of the Inner Mongolia Grassland. Environ. Sci. Policy 2021, 116, 276–286. [Google Scholar] [CrossRef]
- Ren, H.; Schönbach, P.; Wan, H.; Gierus, M.; Taube, F. Effects of grazing intensity and environmental factors on species composition and diversity in typical steppe of Inner Mongolia, China. PLoS ONE 2012, 7, e52180. [Google Scholar] [CrossRef] [Green Version]
- Tong, S.; Zhang, J.; Bao, Y. Spatial and temporal variations of vegetation cover and the relationships with climate factors in Inner Mongolia based on GIMMS NDVI3g data. J. Arid Land 2017, 9, 394–407. [Google Scholar] [CrossRef] [Green Version]
- Zhang, Y.; Liang, W.; Liao, Z.; Han, Z.; Xu, X.; Jiao, R.; Liu, H. Effects of climate change on lake area and vegetation cover over the past 55 years in Northeast Inner Mongolia grassland, China. Appl. Clim. 2019, 138, 13–25. [Google Scholar] [CrossRef]
- Liu, X.; Tian, Z.; Zhang, A.; Zhao, A.; Liu, H. Impacts of Climate on Spatiotemporal Variations in Vegetation NDVI from 1982–2015 in Inner Mongolia, China. Sustainability 2019, 11, 768. [Google Scholar] [CrossRef] [Green Version]
- Ma, W.; Liu, Z.; Wang, Z.; Wang, W.; Liang, C.; Tang, Y.; He, J.-S.; Fang, J. Climate change alters interannual variation of grassland aboveground productivity: Evidence from a 22-year measurement series in the Inner Mongolian grassland. J. Plant Res. 2010, 123, 509–517. [Google Scholar] [CrossRef] [PubMed]
- Lauenroth, W.K.; Sala, O.E. Long-Term Forage Production of North American Shortgrass Steppe. Ecol. Appl. 1992, 2, 397–403. [Google Scholar] [CrossRef] [Green Version]
- Knapp, A.K.; Smith, M.D. Variation among biomes in temporal dynamics of aboveground primary production. Science 2001, 291, 481–484. [Google Scholar] [CrossRef] [PubMed] [Green Version]
- Oesterheld, M.; Loreti, J.; Semmartin, M.; Sala, O.E.; Oesterheld, M.; Semmartin, M. Inter-Annual Variation in Primary Production of a Semi-Arid Grassland Related to Previous-Year Production. J. Veg. Sci. 2001, 12, 137. [Google Scholar] [CrossRef]
- Li, C.; Wang, J.; Hu, R.; Yin, S.; Bao, Y.; Ayal, D.Y. Relationship between vegetation change and extreme climate indices on the Inner Mongolia Plateau, China, from 1982 to 2013. Ecol. Indic. 2018, 89, 101–109. [Google Scholar] [CrossRef]
- An, N.; Price, K.P.; Blair, J.M. Estimating above-ground net primary productivity of the tallgrass prairie ecosystem of the Central Great Plains using AVHRR NDVI. Int. J. Remote Sens. 2013, 34, 3717–3735. [Google Scholar] [CrossRef]
- Na, L.; Na, R.; Zhang, J.; Tong, S.; Shan, Y.; Ying, H.; Li, X.; Bao, Y. Vegetation Dynamics and Diverse Responses to Extreme Climate Events in Different Vegetation Types of Inner Mongolia. Atmosphere 2018, 9, 394. [Google Scholar] [CrossRef] [Green Version]
- Yao, Y.; Liu, Y.; Wang, Y.; Fu, B. Greater increases in China’s dryland ecosystem vulnerability in drier conditions than in wetter conditions. J. Environ. Manag. 2021, 291, 112689. [Google Scholar] [CrossRef] [PubMed]
- Zhang, X.; Wang, J.; Gao, Y.; Wang, L. Variations and controlling factors of vegetation dynamics on the Qingzang Plateau of China over the recent 20 years. Geogr. Sustain. 2021, 2, 74–85. [Google Scholar] [CrossRef]
- Huang, W.; Ge, Q.; Wang, H.; Dai, J. Effects of multiple climate change factors on the spring phenology of herbaceous plants in Inner Mongolia, China: Evidence from ground observation and controlled experiments. Int. J. Clim. 2019, 39, 5140–5153. [Google Scholar] [CrossRef]
- Guo, X.; Chen, R.; Thomas, D.S.G.; Li, Q.; Xia, Z.; Pan, Z. Divergent processes and trends of desertification in Inner Mongolia and Mongolia. Land Degrad. Dev. 2021, 32, 3684–3697. [Google Scholar] [CrossRef]
- Cao, J.; Li, M.; Deo, R.C.; Adamowski, J.F.; Cerdà, A.; Feng, Q.; Liu, M.; Zhang, J.; Zhu, G.; Zhang, X.; et al. Comparison of social-ecological resilience between two grassland management patterns driven by grassland land contract policy in the Maqu, Qinghai-Tibetan Plateau. Land Use Policy 2018, 74, 88–96. [Google Scholar] [CrossRef] [Green Version]
- Cao, J.; Xu, X.; Deo, R.C.; Holden, N.M.; Adamowski, J.F.; Gong, Y.; Feng, Q.; Yang, S.; Li, M.; Zhou, J.; et al. Multi-household grazing management pattern maintains better soil fertility. Agron. Sustain. Dev. 2018, 38, 6. [Google Scholar] [CrossRef] [Green Version]
- Wang, F.; Pan, X.; Wang, D.; Shen, C.; Lu, Q. Combating desertification in China: Past, present and future. Land Use Policy 2013, 31, 311–313. [Google Scholar] [CrossRef]
- Miao, L.; Moore, J.C.; Zeng, F.; Lei, J.; Ding, J.; He, B.; Cui, X. Footprint of Research in Desertification Management in China. Land Degrad. Dev. 2015, 26, 450–457. [Google Scholar] [CrossRef]
- Li, H.; He, S.; Gao, Y.; Chen, H.; Wang, H. North Atlantic Modulation of Interdecadal Variations in Hot Drought Events over Northeastern China. J. Clim. 2020, 33, 4315–4332. [Google Scholar] [CrossRef]
- An, Q.; He, H.; Nie, Q.; Cui, Y.; Gao, J.; Wei, C.; Xie, X.; You, J. Spatial and Temporal Variations of Drought in Inner Mongolia, China. Water 2020, 12, 1715. [Google Scholar] [CrossRef]
- Ying, H.; Zhang, H.; Zhao, J.; Shan, Y.; Zhang, Z.; Guo, X.; Rihan, W.; Deng, G. Effects of spring and summer extreme climate events on the autumn phenology of different vegetation types of Inner Mongolia, China, from 1982 to 2015. Ecol. Indic. 2020, 111, 105974. [Google Scholar] [CrossRef]
- Chen, J.; John, R.; Shao, C.; Fan, Y.; Zhang, Y.; Amarjargal, A.; Brown, D.G.; Qi, J.; Han, J.; Lafortezza, R.; et al. Policy shifts influence the functional changes of the CNH systems on the Mongolian plateau. Environ. Res. Lett. 2015, 10, 85003. [Google Scholar] [CrossRef]
Figure 1.
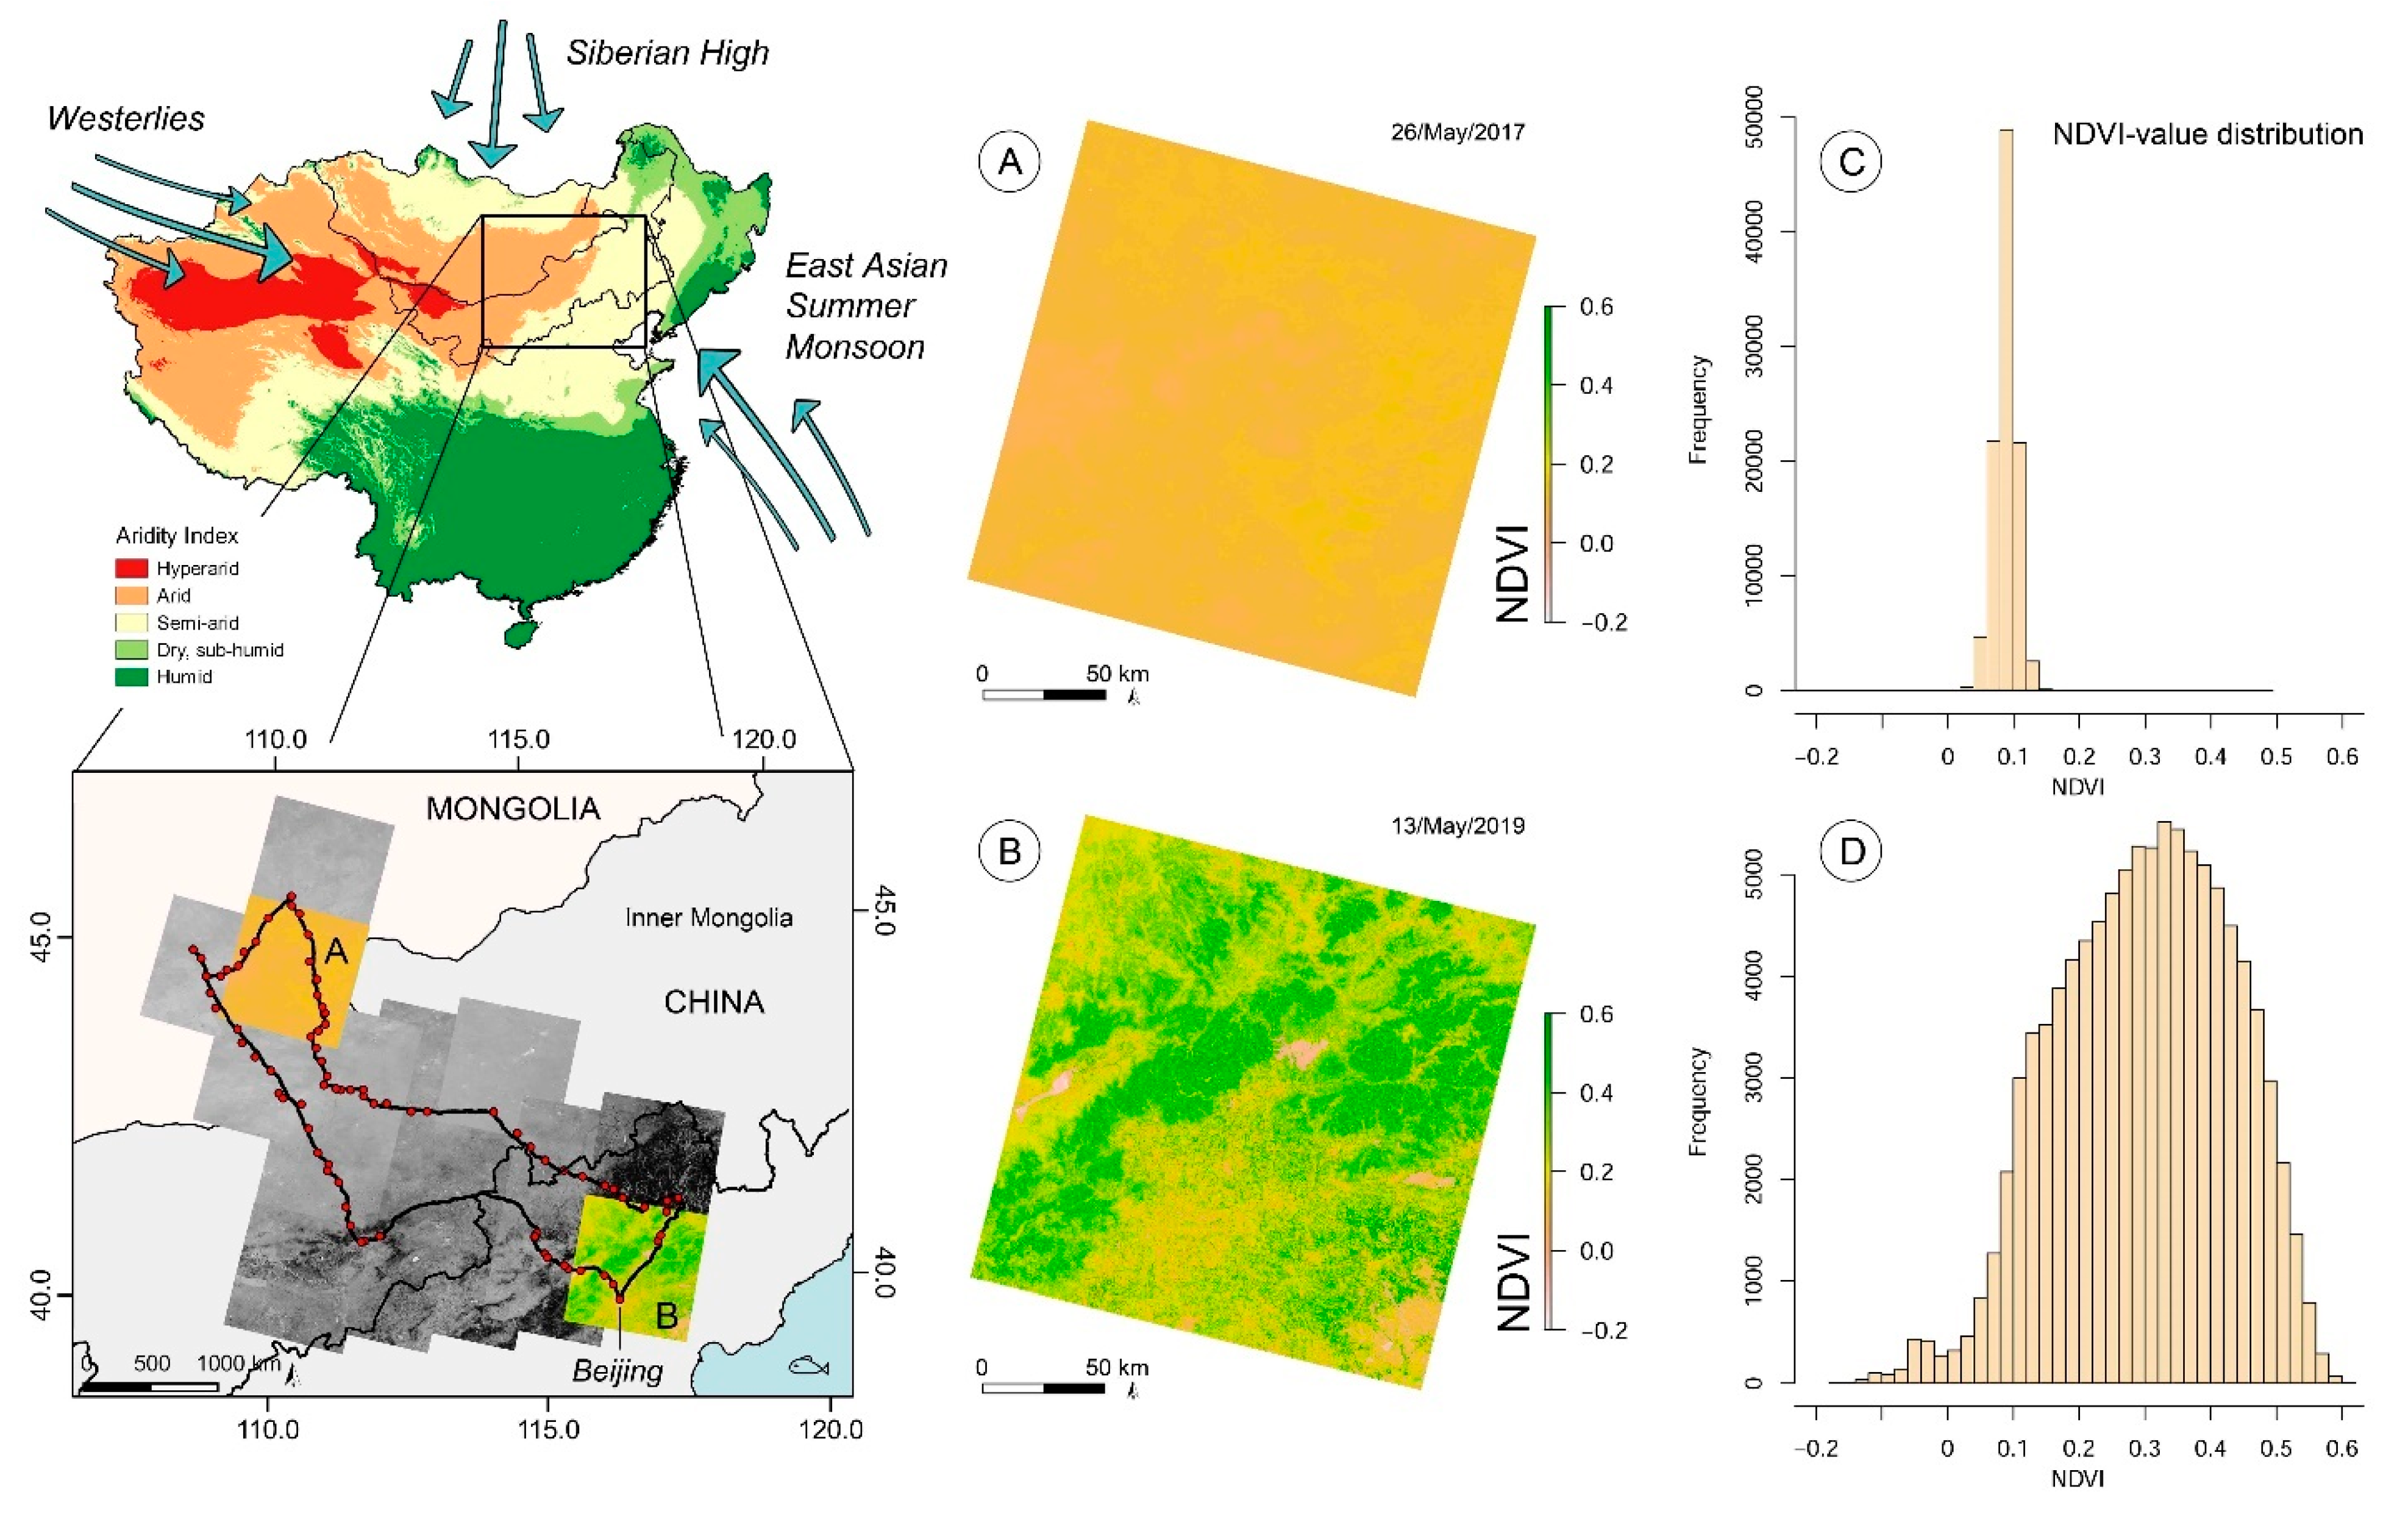
The study area in northern China and the southern part of Mongolia, covering approximately 433,425 km2. A set of medium resolution Landsat-OLI-8 hyperspectral satellite image sets the extent of the temporal series reference area (USGS, last accessed 5 January 2021). Vegetation indices (NDVI) allow for the evaluation of surface conditions through reflectance characteristics and eventually the differentiation into bare areas, vegetation-covered areas, and modern built-up (compare sections A and B). The threshold histograms (C,D) show the signal’s differences of two comparison sections in the north with extensive sand cover (A,C) and the south over Beijing with mosaic vegetation cover and extensive built-up (B,D). The aridity index is based on the Global Aridity Index and Potential Evapotranspiration Climate Database v2 [51].
Figure 1.
The study area in northern China and the southern part of Mongolia, covering approximately 433,425 km2. A set of medium resolution Landsat-OLI-8 hyperspectral satellite image sets the extent of the temporal series reference area (USGS, last accessed 5 January 2021). Vegetation indices (NDVI) allow for the evaluation of surface conditions through reflectance characteristics and eventually the differentiation into bare areas, vegetation-covered areas, and modern built-up (compare sections A and B). The threshold histograms (C,D) show the signal’s differences of two comparison sections in the north with extensive sand cover (A,C) and the south over Beijing with mosaic vegetation cover and extensive built-up (B,D). The aridity index is based on the Global Aridity Index and Potential Evapotranspiration Climate Database v2 [51].

Figure 3.
Landcover in the study area in 2019 and 1688 compared to topographical elements and the historical route reconstruction from 1688 [53,57,58]. The reconstructed landcover of 1688 is overlaid on modern Copernicus landcover data from 2019. During May to October 1688, Gerbillon crossed large parts of northern China and southern Mongolia and turned back to Beijing after half a year. He reported weather as well as surface and vegetation conditions and enabled the reconstruction of past landcover conditions during the Maunder Minimum of the Little Ice Age.

Figure 4.
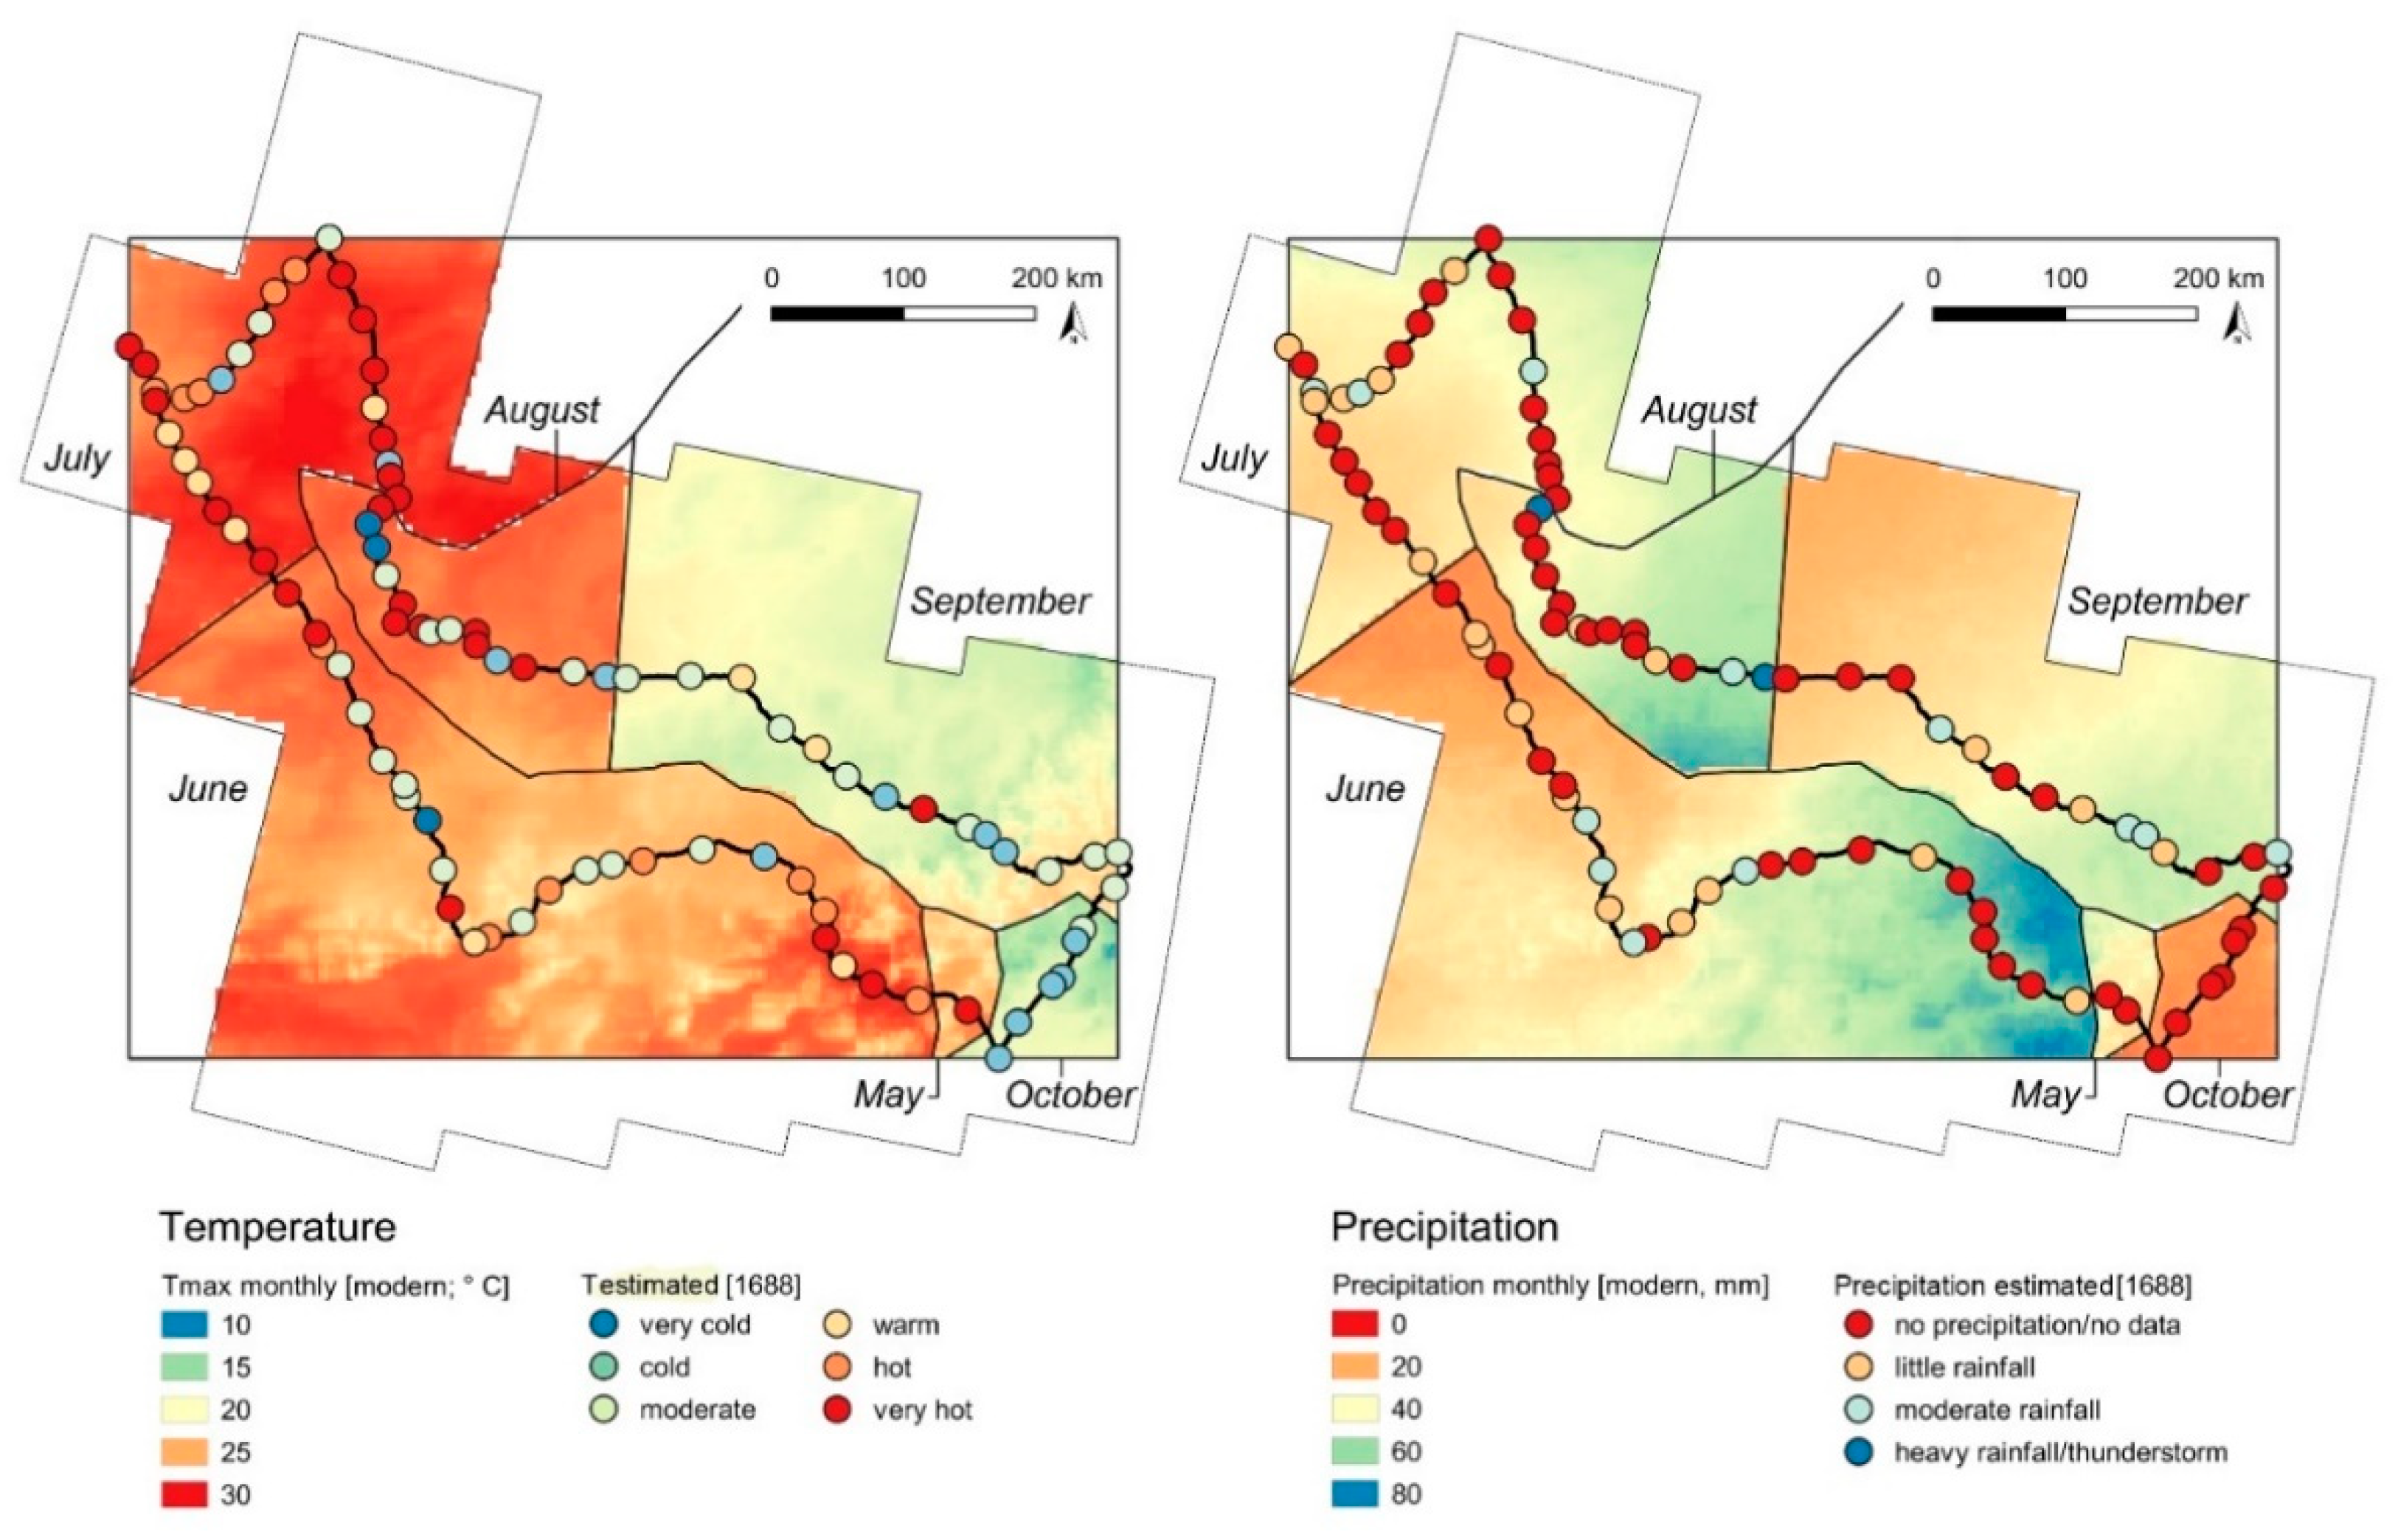
Average monthly temperature and precipitation grid in the study area from May to October. The reconstructed climatic conditions from 1688 were plotted on top of the modern dataset to highlight differences and similarities during the Little Ice Age [53,60,61].

Figure 5.
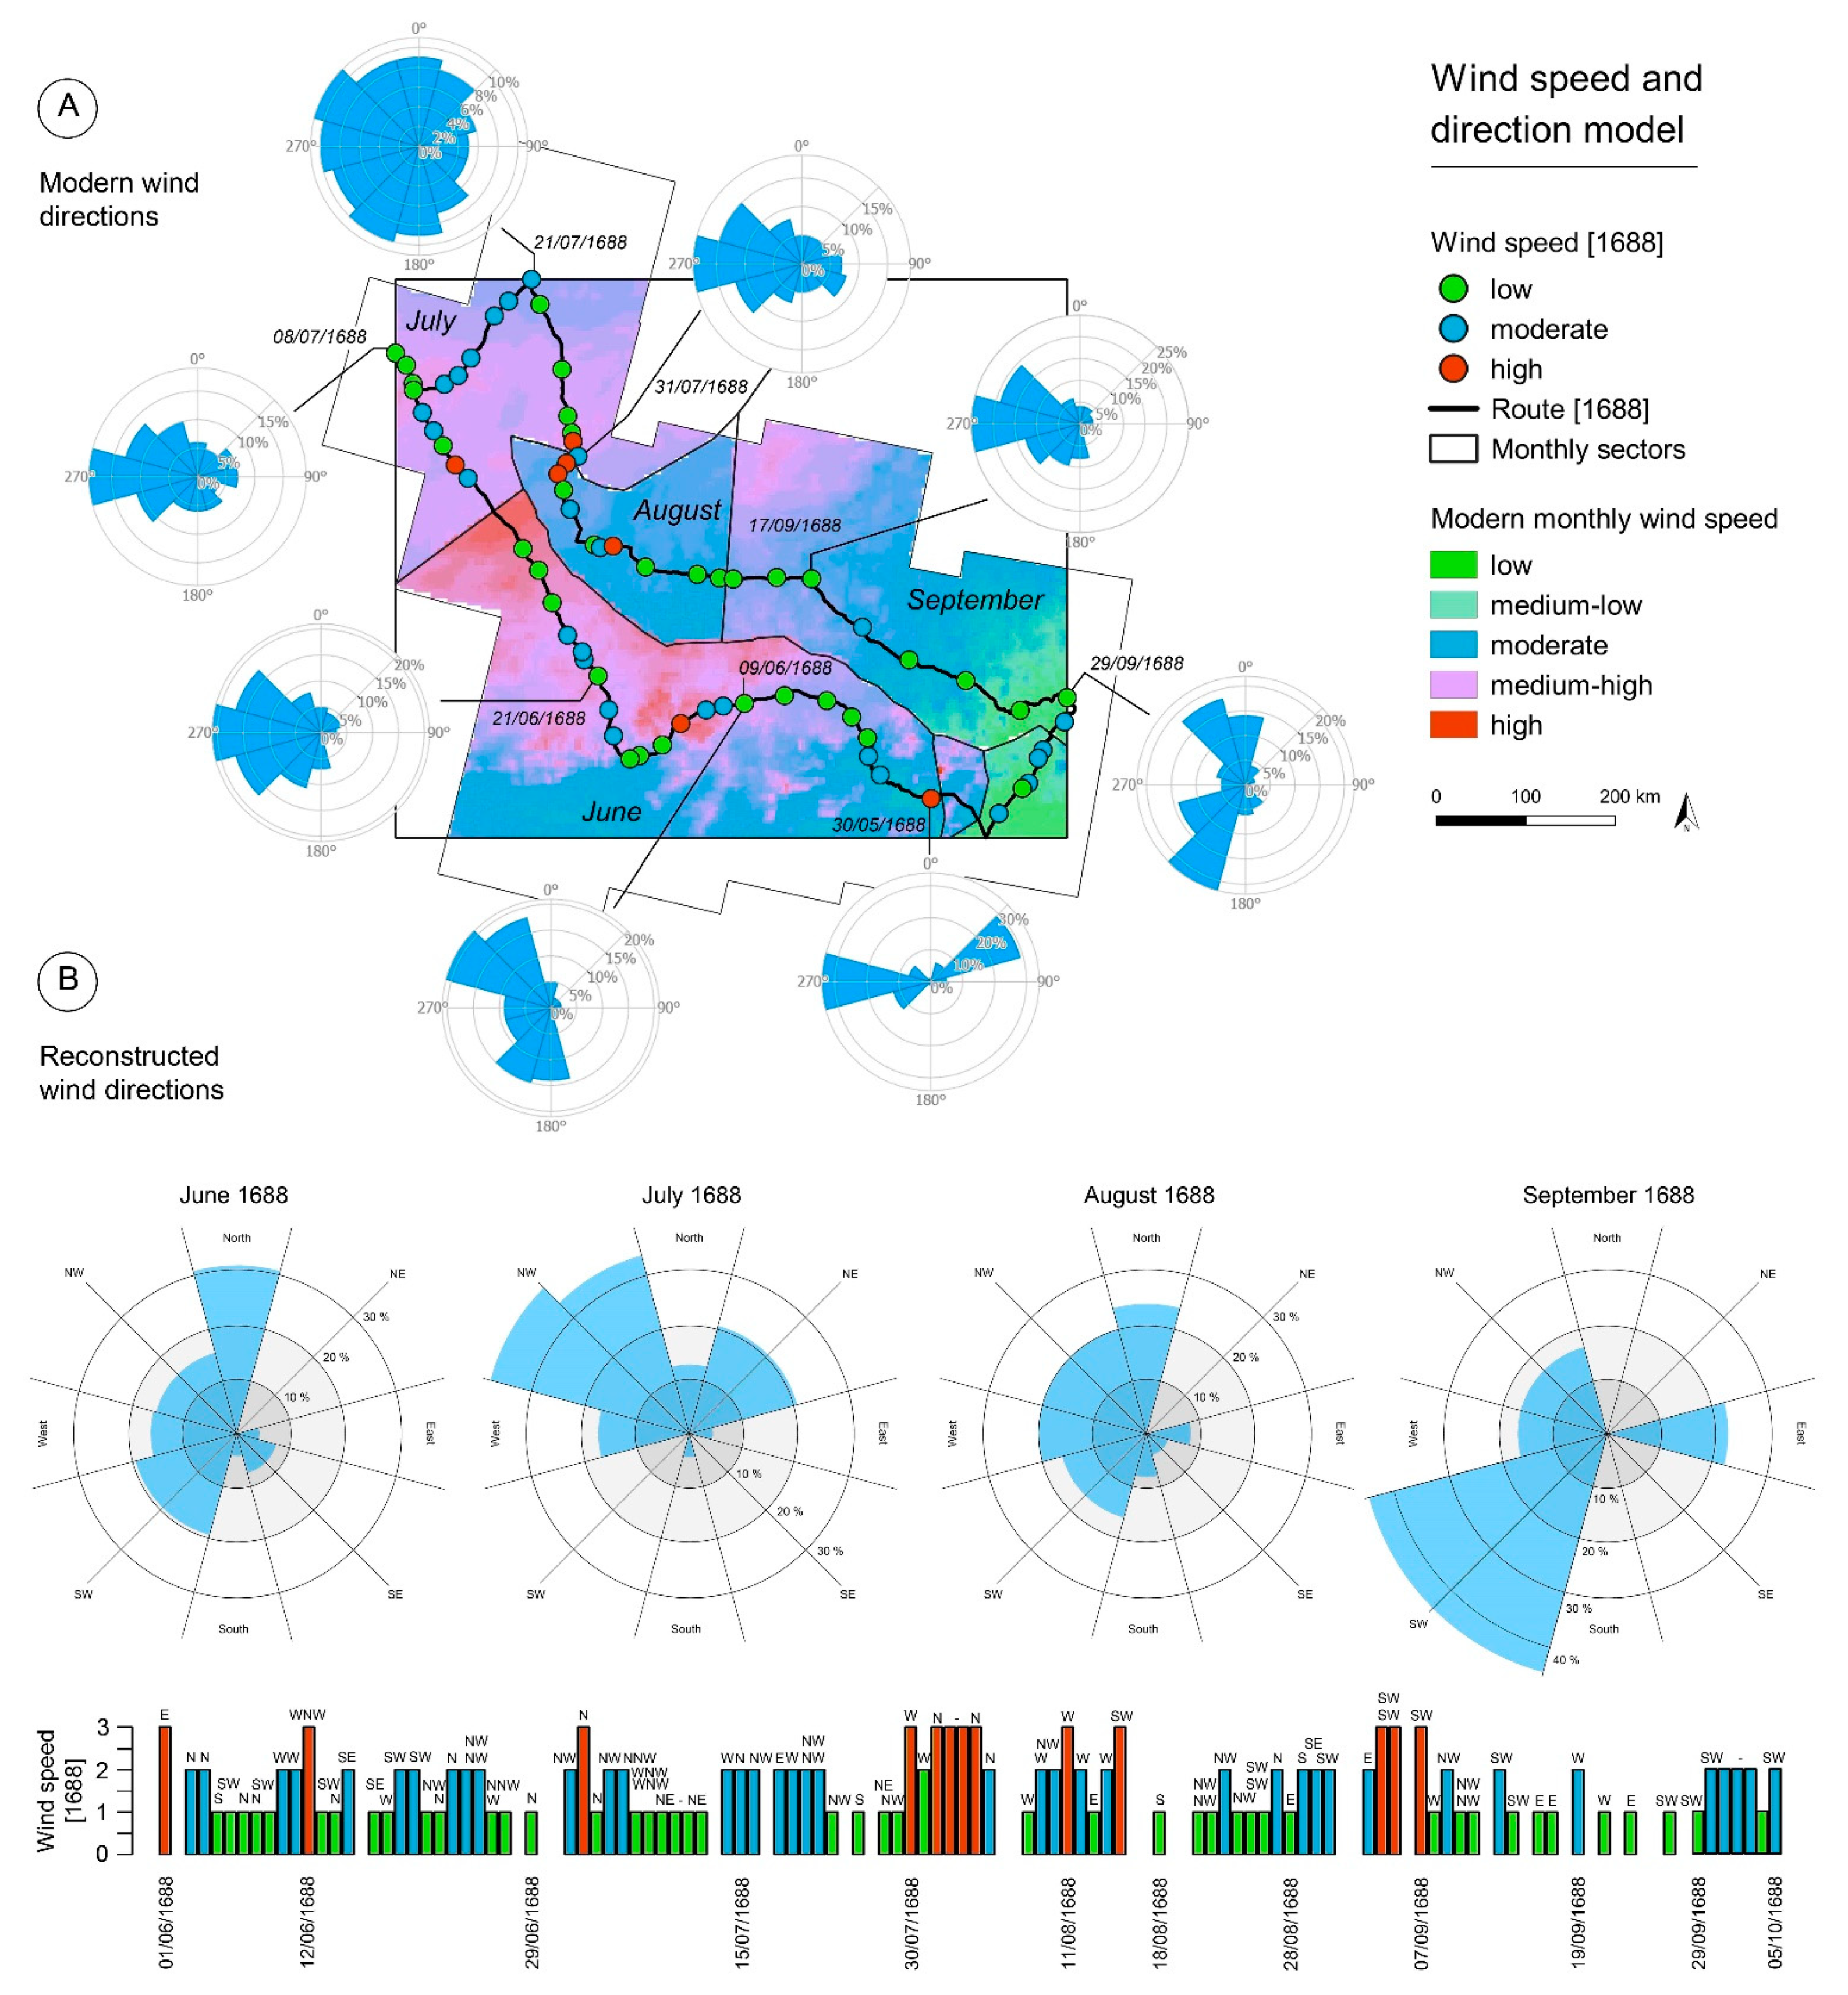
(A) Modern average monthly windspeed diagrams of the study area from May to October [63]. (B) Reconstructed wind directions for June–September 1688. May and October did not provide sufficient data. The reconstructed windspeeds and directions were plotted with modern datasets to underline the current trend towards increased windspeed, north-western wind direction, and sand transport and enhanced desertification risk.
Figure 5.
(A) Modern average monthly windspeed diagrams of the study area from May to October [63]. (B) Reconstructed wind directions for June–September 1688. May and October did not provide sufficient data. The reconstructed windspeeds and directions were plotted with modern datasets to underline the current trend towards increased windspeed, north-western wind direction, and sand transport and enhanced desertification risk.

Figure 6.
Paleoclimate reconstruction from six study sites in China and Mongolia. Raw data acquired from NOAA-National Centers for Environmental Information (last accessed 5 January 2021) and plotted by the author using a locally estimated scatterplot smoother (LOESS) and R software [64]; smoothing parameters 1 (blue line, plot C, D), 0.5 (green line), 0.3 (red line). The year 1688 is marked with a vertical, the average value with a horizontal blue line. (A,B): Precipitation reconstruction based on tree-ring chronologies for two regions in China [68]. (C): Temperature anomaly and (D): reconstructed temperature based on a stalagmite from Shihua Cave, Beijing, China and instrumental meteorological records [65]. (E): River Kherlen long-term streamflow variation based on [7] and spatial and temporal tree-ring replication and nested model methods [66]. (F): Streamflow variation of the river Selenge in Mongolia based on tree-ring-width chronologies [67]. (G): Precipitation reconstruction in north-eastern Mongolia based on tree-ring-width data [7].

Figure 7.
Trend analysis of vegetation response to climate change over the period 2001–2020. (A) MODIS NDVI trend analysis with a 95% confidence level; (B) cropped research core area with NDVI trends; (C) precipitation trends with 50% and 95% confidence level; (D) temperature trends with 50% and 95% confidence level. White areas show a lower significance level.

Figure 8.
Temporal series of annual NDVI anomalies in China and Mongolia compared to the reference period 2001–2020. From the data, a clear trend in positive vegetation growth anomalies can be observed, particularly since 2015. The MODIS dataset for 2000 is incomplete and is marked in grey.
Figure 8.
Temporal series of annual NDVI anomalies in China and Mongolia compared to the reference period 2001–2020. From the data, a clear trend in positive vegetation growth anomalies can be observed, particularly since 2015. The MODIS dataset for 2000 is incomplete and is marked in grey.

Figure 9.
Correlation of annual Ptotal sums and NDVI and temperature and NDVI over the period 2001–2020. Greening trends in the study area are strongly correlated to an increase in precipitation.
Figure 9.
Correlation of annual Ptotal sums and NDVI and temperature and NDVI over the period 2001–2020. Greening trends in the study area are strongly correlated to an increase in precipitation.

Publisher’s Note: MDPI stays neutral with regard to jurisdictional claims in published maps and institutional affiliations. |
© 2022 by the author. Licensee MDPI, Basel, Switzerland. This article is an open access article distributed under the terms and conditions of the Creative Commons Attribution (CC BY) license (https://creativecommons.org/licenses/by/4.0/).
Share and Cite
MDPI and ACS Style
Kempf, M. Documentary Evidence of 17th Century Landcover and Climate Change in Northern China and Mongolia Compared to Modern Spectral Greening Trends. Land 2022, 11, 100. https://doi.org/10.3390/land11010100
AMA Style
Kempf M. Documentary Evidence of 17th Century Landcover and Climate Change in Northern China and Mongolia Compared to Modern Spectral Greening Trends. Land. 2022; 11(1):100. https://doi.org/10.3390/land11010100
Chicago/Turabian StyleKempf, Michael. 2022. "Documentary Evidence of 17th Century Landcover and Climate Change in Northern China and Mongolia Compared to Modern Spectral Greening Trends" Land 11, no. 1: 100. https://doi.org/10.3390/land11010100
Note that from the first issue of 2016, this journal uses article numbers instead of page numbers. See further details here.